Axis Bank: Bounce from the support and Elliott Wave Analysis
Axis Bank Daily chart
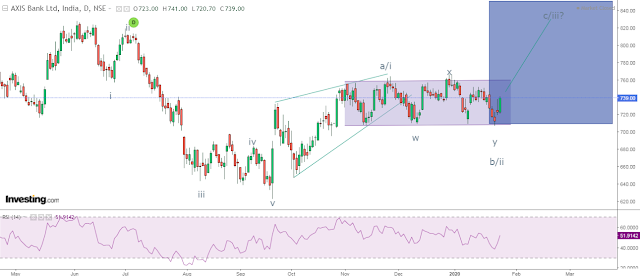

Axis Bank is moving in a sideways pattern (marked purple color), this range is of 60 points from 705 765. Prices persists in this range, as far as it does no trending move is expected. recently its quarterly results were announced which was robust. Prices bounce from the lower end of the support range which and is now moving towards 765.
As per wave theory, prices are moving in wave b/ii, once this is complete wave c /iii will open which can surge price to 820-830 levels which is 100% of wave a/i, which is in leading diagonal formation.
Learn Elliott and Neo Wave with e in a 4 day course which will be a classroom training or a webinar. The cost will be Rs 10500/- or $155. For inquiry contact +919324174580.


Comments