MCX Aluminum: Post Ending Diagonal pattern
MCX Aluminium is moving down by forming a lower high and lower low formation. The metal is also moving precisely in a falling red channel. As of now it is consolidating near the channel resistance and it is getting ready to reverse.
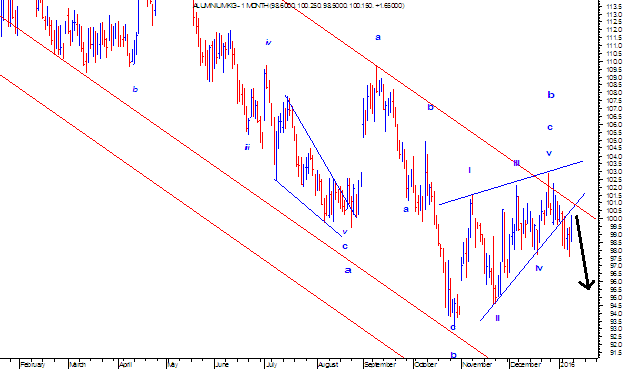
Prices are moving down in a simple (a-b-c) or (w-x-y) pattern as of now. Recently it completed wave b in which the last leg i.e. wave c was an ending diagonal pattern. Now it can move down in the form of wave c which can be an impulse on the downside or wave y which can be further corrective pattern, but both the alternatives suggests that one leg on the downside is pending.
In the below chart, after completing the ending diagonal pattern, prices moved below the lower trend line of the wedge pattern and then it pulled back to test the lower trend line again. This clearly suggest that it has arrived near the resistance.
In short, expect prices to move down near till 95 levels over short term as far as the level of 100.90 is intact on the upside. The bias is firmly negative for this metal.
MCX Aluminium 1st Month Chart (Daily)


Comments