USDINR: Alternative Wave Counts
In my previous post of USDINR " USDINR: Implusive Wave", I had mentioned that probably the pair will reverse and can test the level of 65.50. However, prices moved above 66.40 which was a crucial resistance thus breaking the downward sloping red channel.
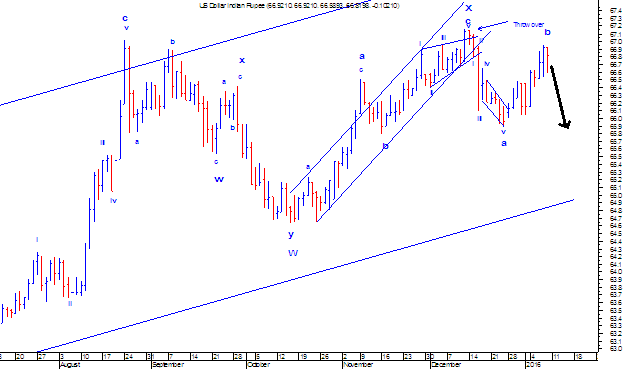
Now to understand the current setup it is imperative to see the bigger picture. From the below daily chart, from August 2015 till date. Prices are moving in a range of 64.80-67 levels. As per wave theory, the fall from August top i.e. from 67.01, prices moved in a 3 wave structure (a-b-c) and completed one higher degree at 64.63 levels. Thereafter, when it started moving up it again touched the high of 67.15 in 3 wave structure (a-b-c). Now the fall from 67.15 which earlier looks to be am impulsive can also be counted as (a-b-c) which is complex in nature.
Last week the pair crossed the high of 66.40 and made a new high of 66.94 levels. The current up move is also a corrective structure and I placed it as wave b, which is also 80% retracement of previous fall. By saying this, one more leg on the downside is pending in the form of wave c, which can be equal to wave a.
Whether a corrective or an impulsive wave, it is imminent that prices will reverse as one more leg on the downside is pending. The first level will be at 66.00 followed by 65.80.
USDINR Alternative Wave counts on Daily chart.


Comments