ACC: Neo Wave Diametric Pattern Anticipated Happened
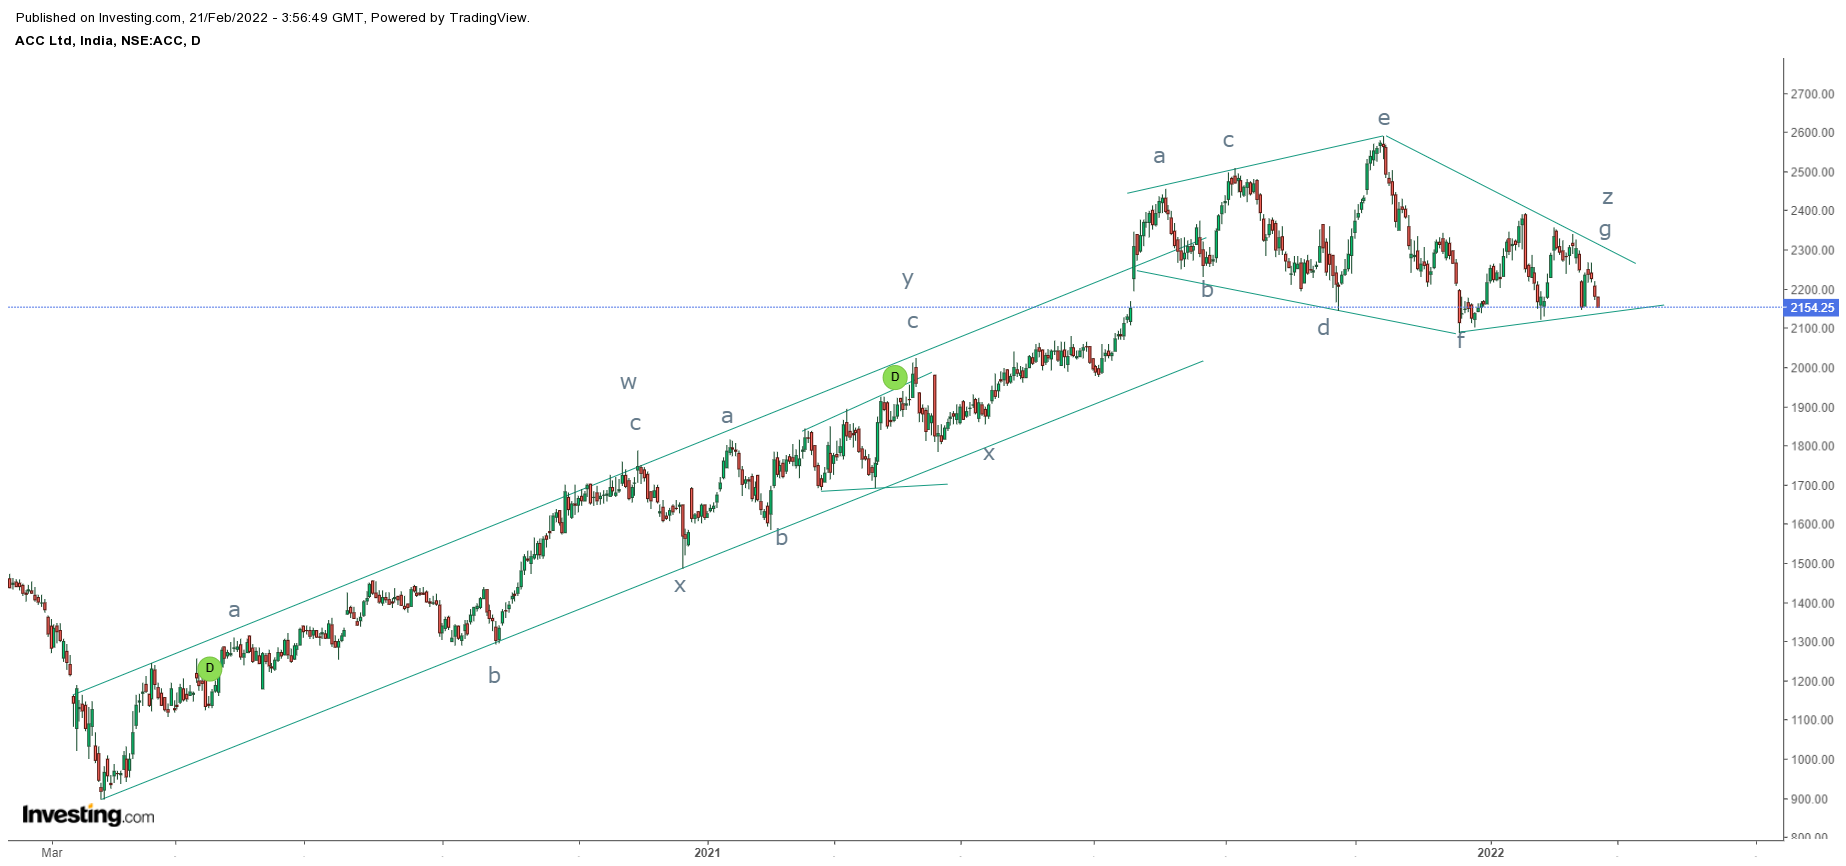
ACC daily chart anticipated on 21st Feb 2022
ACC daily chart happened on 7th March 2022

In my previous update for ACC, I had mentioned that, " ACC can move down till 1850 levels over short term, once the level of 2100 is broken decisively."
Prices slumped after breaking 2100, opening well below it and made a low of 1900 which was close to my mentioned target of 1850, gaining 9.52% - Anticipated Happened
To view my previous article on ACC dated 21st Feb, click on the below link
https://www.marketanalysiswithmeghmody.com/2022/02/acc-neo-wave-diametric-pattern.html
The current fall is an impulse and prices are now moving higher to form wave b or wave ii, so the short term bias is positive and will continue to monitor the movement as and when the wave unfolds.


Comments