Nifty as expected
The below article was written on Sunday before market opened. I was continuously bullish for the index but was waiting for price confirmation. Elliott Wave and Neo wave helps you to understand the possible reversal and riding the entire trend. This is what I have captured. Learn Elliott Wave and Neo Wave in my two day paid webinar. The run time will be 15 hrs and the fees will be 15000/- rupees.
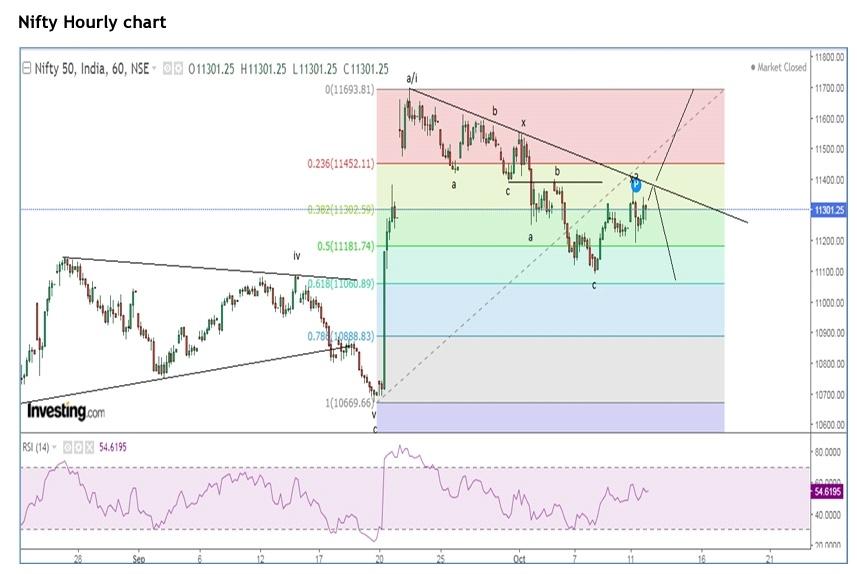
In the hourly chart, Nifty has not moved above its previous high and is facing resistance of the falling trend line. It will be important to see what will be the price action on Monday. Any move above 11400 is a buy for prices to reach till 11550-11600 levels.
From wave perspective, I will continue to have two probabilities in the above chart as mentioned last week, one is prices will continue to move in a triple correction pattern (a-b-c-x-a-b-c-x-a-b-c). As of now it has only completed double correction (a-b-c-x-a-b-c). However, any move above 11400 will indicate that prices have completed double correction and have started wave iii/c higher.
The summation of the above chart is, Nifty bounced from the support of 11050-11100 levels. Any move above 11400 will open further positive possibilities soaring prices till 11550-11600 levels over short term. However, any move below 11250 will drag prices lower till 11100.


Comments