MCX Crude: Anticipated Happened
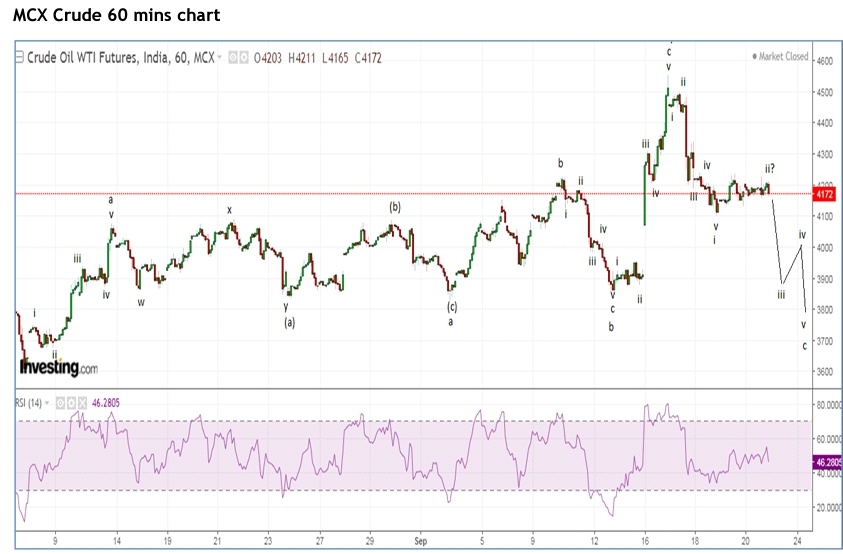
From above hourly chart, prices are now moving in a lower high and lower low after marking a high of 4500 odd levels. The lower highs and lower lows will not favor prices to rise from current juncture.
As per wave theory, prices have completed wave b t one higher degree where the internal counts were (w-x-y) eventually flat pattern as it retraced more than 80% of the previous fall of wave a (4692- 3522). So if wave b is over wave c has already started which is an impulse in nature and can move down till 3750 levels.
The summation of the above two chart is, MCX Crude is negatively poised and can tumble near till 3750 levels as far as 4265 is protected on closing basis.
The above analysis was done on 23rd of September 2019. I had mentioned that it will come down to 3750 which it made a low today by moving down below 3750.
Learn Elliott Wave and Neo wave from us which will be a two day webinar teaching all the important concepts of Elliott and Neo wave in 15 hours session and it's cost will be 15000/-. Don't delay it,learn and become a proud wave practitioner.


Comments