Nifty Elliott Wave Analysis
Nifty daily chart
Nifty 2 hour chart
Analysis
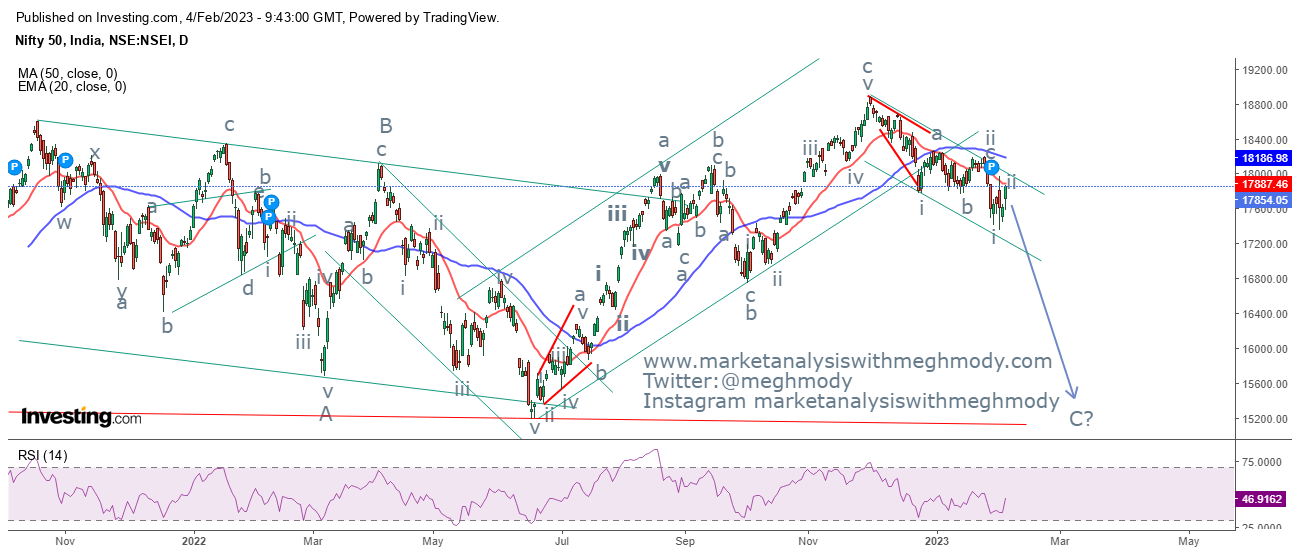
As seen in the daily chart, prices are moving in a lower high and lower low formation which is a negative sign. Also the short term moving average is negatively poised and it is now acting as a crucial resistance. After the Budget 2023-24, prices have come up and closed below the short term moving average 20 EMA (red). The moving average is now suggesting that the trend for the index is negative. Along with that RSI is also relieving from the oversold terrain.
From 2 hour chart, the index here to is facing the resistance of the moving averages of 50 SMA periods which is an indication that the bias is firmly negative not only on 2 hour chart but also on daily chart. As far as prices persists in the falling channel, the bias is negative for the index.
Wave theory suggests that, prices have opened wave iii lower of wave C of one higher degree. In this wave iii, it is extended where it has completed wave i and wave ii of wave iii and now it has unfolded wave iii of wave iii which can go till 16600 levels which is 161.8% of wave i to wave ii of wave iii of iii.. If prices move above 18100 levels then the entire structure will be corrective and not impulse as shown.
The summation is Nifty will plunge towards 16600 over short term and over medium term it is likely to test 15500 levels as far as 18100 is intact on the upside.


Comments