USDINR: Anticipated Happened and Elliott Wave Analysis
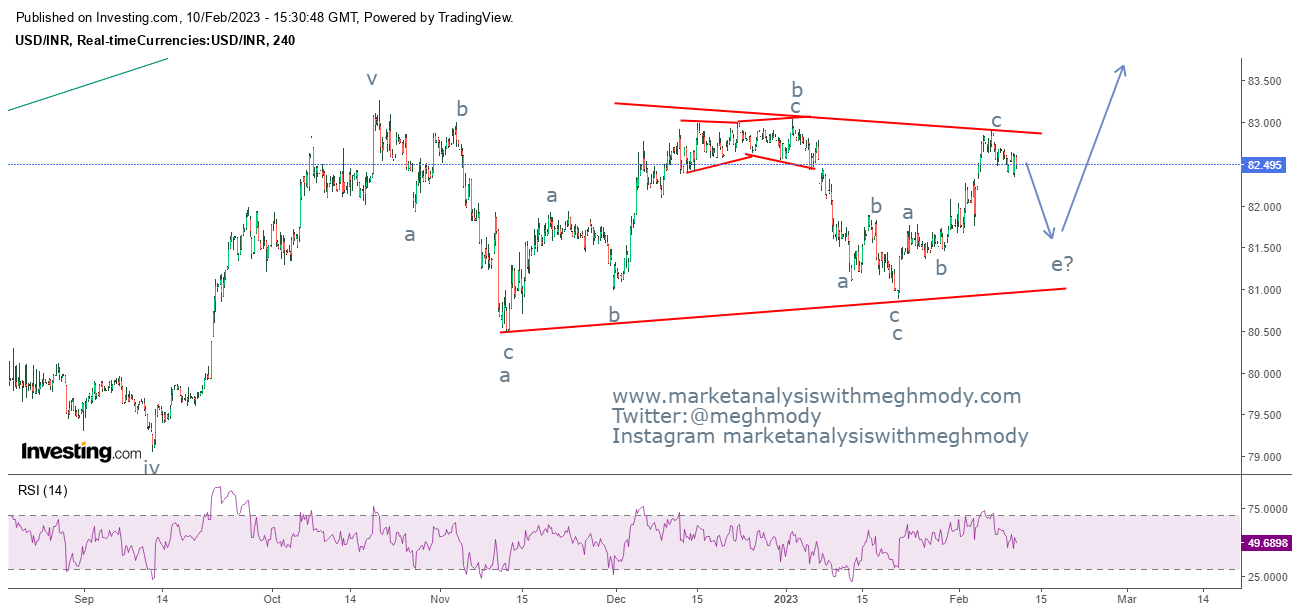
USDINR 240 mins chart
Analysis
In my previous article I had mentioned that USDINR can move towards 82.80 when it was quoting at 82.16. On 6th February, the pair achieved my mentioned level - Anticipated Happened
To read my previous article on USDINR, click on the below mentioned link
https://www.marketanalysiswithmeghmody.com/2023/02/usdinr-towards-8280.html
As shown in the above chart, prices are moving in a symmetrical triangle pattern. Recently when it came to test the higher side of the pattern it faced the resistance of 82.80-82.90 levels. From this supply zone it started moving lower and made a low of 82.32 but closed well above 82.50 levels. It is very evident that it will continue to fall from current levels as RSI is below the center line.
Along with that, Wave theory suggests that prices have completed wave d at 89.90 levels and it has opened wave e which is the last leg of the triangle (a-b-c-d-e). This ongoing down leg can move down towards 81.80-81.60 levels where 50% falls at 81.80 and 61.8% comes to 81.60 levels. Once this pattern is complete it will also complete wave 4 on one higher degree which will then open wave 5 on the higher side.
The summation is USDINR can fall below 82 in coming weeks which can drag prices close to 81.80-81.60 price zone over short term.


Comments