Posts

EURUSD : Revisited

Image
 EURUSD daily chart Analysis I had mentioned about the single currency in the month of November that, " EURUSD has changed its direction and has shown massive strength which will soar prices near till 1.07-1.09 levels over short term." EURUSD surpassed the level of 1.09 levels and from there it is consolidating within the range of 1.0850-1.0920 levels. I was bullish for this currency when it was trading at 1.0350 levels. To read my previous article on EURUSD, click on the below mentioned link. https://www.marketanalysiswithmeghmody.com/2022/11/dxyeurusdgbpusdusdjpy-elliott-wave.html EURUSD is currently trading in wave v which is the last leg of this impulse move. However, there is a minor leg pending on the upside which can take prices near till 1.0930-40 levels. Once this leg is over wave v will end in an ending diagonal pattern. After that wave a on the downside will open which can drag prices towards 1.06-1.05 range over short to medium term. The summation is EURUSD can fa

Nifty Elliott Wave Analysis

Image
 Nifty daily chart Nifty 120 mins chart Analysis In my previous update on Nifty dated 15th January 2023, I had mentioned that, " Nifty has one minor leg on the downside towards 17800-17750 which once completed can soar prices towards 18350-18400 levels over short term." Nifty moved lower towards 17850 levels close to my mentioned level of 17800-17750 and then started moving higher. It made a high of 18188 after that and has come back towards 18000 levels. To read my previous article on Nifty, click on the below mentioned link https://www.marketanalysiswithmeghmody.com/2023/01/nifty-elliott-wave-analysis.html From the daily chart, Nifty came down towards 17800-17750 levels where it ended its minor leg on the downside and then started moving higher. For RSI there is plenty of vacuum to come to overbought terrain which indicates that the bias for the index is positive going ahead. As per 120 mins chart, the index has not only completed the falling wedge pattern but also moved ab

Bank Nifty Elliott Wave Analysis

Image
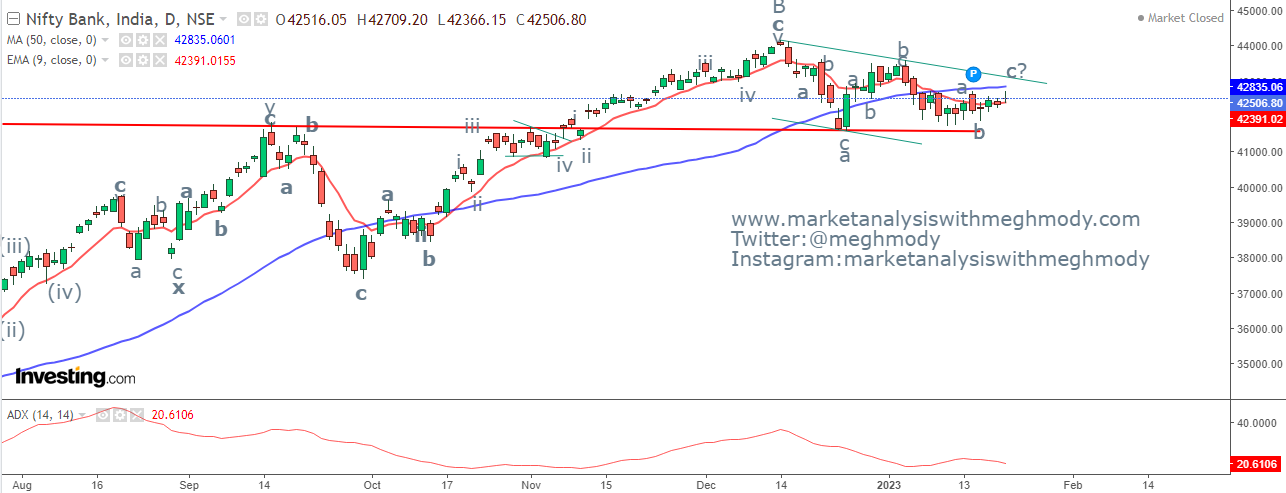
 Bank Nifty daily chart Bank Nifty 120 mins chart Analysis As seen in the daily chart, prices continue to move in a sideways to positive trend with bias slightly upside. Previously I had mentioned that Bank Nifty can move towards 43000 and I will continue to hold my target with support intact at 41600.  The level of 43000 is where the resistance of the trend line is placed which can be tested. Any move above this level will open further positive possibilities.  From 120 mins chart, prices after forming a base of 41800 has crossed the level of 42500. Remember I was bullish for the index when it is trading at 42371 and hade mentioned that it will soar towards 43000 levels. RSI has enough vacuum to move towards overbought terrain. According to wave theory, prices are either moving in wave x which is the ongoing wave or it is part of wave b. One thing is for sure that it is moving slowly and can test 43000 as part of wave x or wave b. The summation is Bank Nifty is positively poised and ca

USDJPY Elliott Wave Analysis

Image
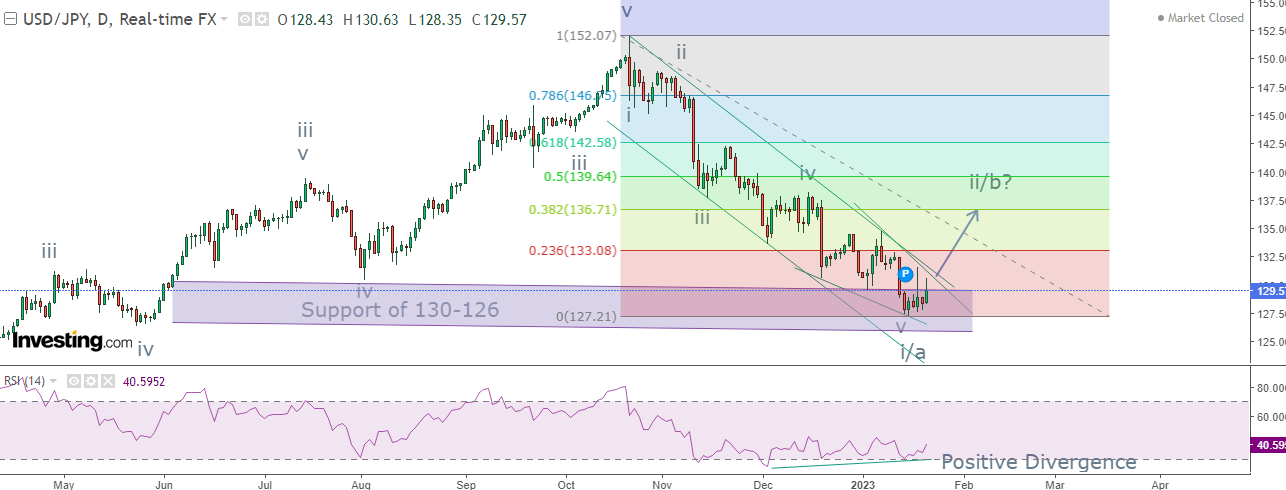
 USDJPY daily chart Analysis As seen in the above daily chart, prices are moving in a lower highs and lower lows which is a negative formation. However, there is some kind of movement at the bottom which signifies that downside is limited or on the brink to reverse.  At the bottom it is very clear that falling wedge pattern is seen which is an indication that prices can possibly end the downtrend and and up move can start. However, there needs to be a price confirmation for it. RSI has also exhibited positive divergence. From Waves perspective, prices have completed five waves down in an impulse pattern at 127.8 levels. It is important for the pair to move above 131.4 which can surge price towards 136.8-137 levels. The summation is USDJPY is set to give a resilience which can soar prices towards 136.8-137 levels, once the level of 131.4 is taken out decisively.

CAC40: Elliott Wave Analysis

Image
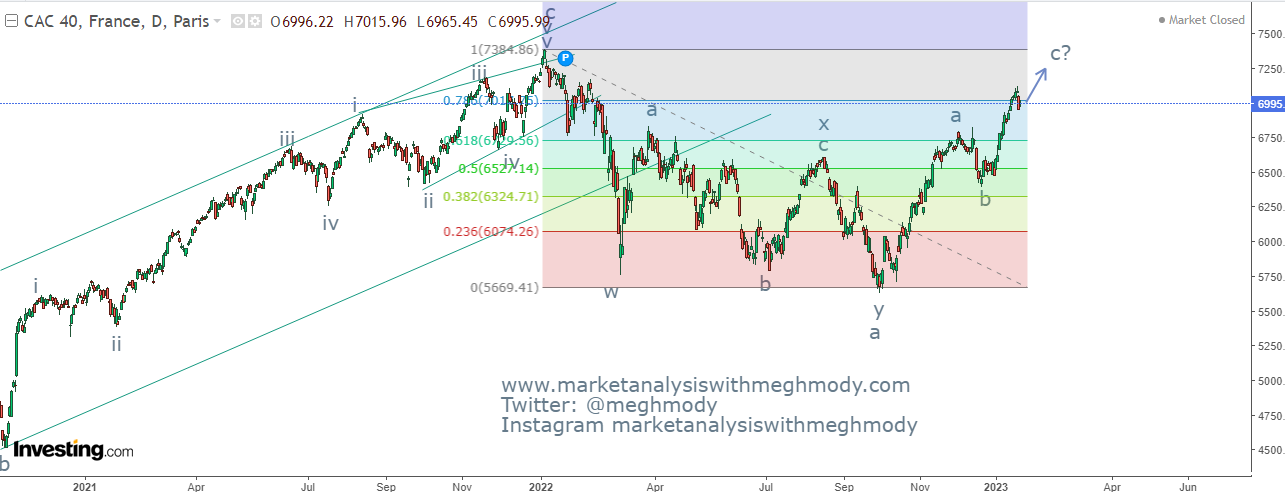
 CAC40 daily chart Analysis From the above chart, prices are moving in a higher highs and higher lows, it seems that prices have some more vacuum on the higher side which can take prices near to its previous high. As per Wave theory, the index is moving in a flat pattern (a-b-c) where it completed wave a and it is currently moving in wave b in which it is moving in wave c where last leg of wave c is pending which is wave v. The summation is CAC40 can move towards 7200-7250 levels from current levels over very short term.

MCX Crude Anticipated Happened

Image
 MCX Crude Oil daily continuous anticipated on 17th Dec 2022 MCX Crude Oil daily continuous happened on 26th December 2022 Analysis In my previous article, I had mentioned that, " MCX Crude Oil is all set to move towards 6500-6600 price range before major fall starts." In no time the black gold moved higher and achieved my mentioned level - Anticipated happened To see my previous article on MCX Crude, click on the below mentioned link https://www.marketanalysiswithmeghmody.com/2022/12/mcx-crude-oil-elliott-wave-analysis.html As seen in the above chart, prices are moving in a lower highs and lower lows which is a negative setup. It is also moving precisely in a falling red channel. At current juncture, Crude Oil prices has arrived near to the resistance of the channel. It is imperative to see if prices cross this resistance or continues to falter. Any move above 6800 will give a bullish break in falling channel pattern. If prices break the level of 6200 on the downside then it

Nifty Elliott Wave Analysis

Image
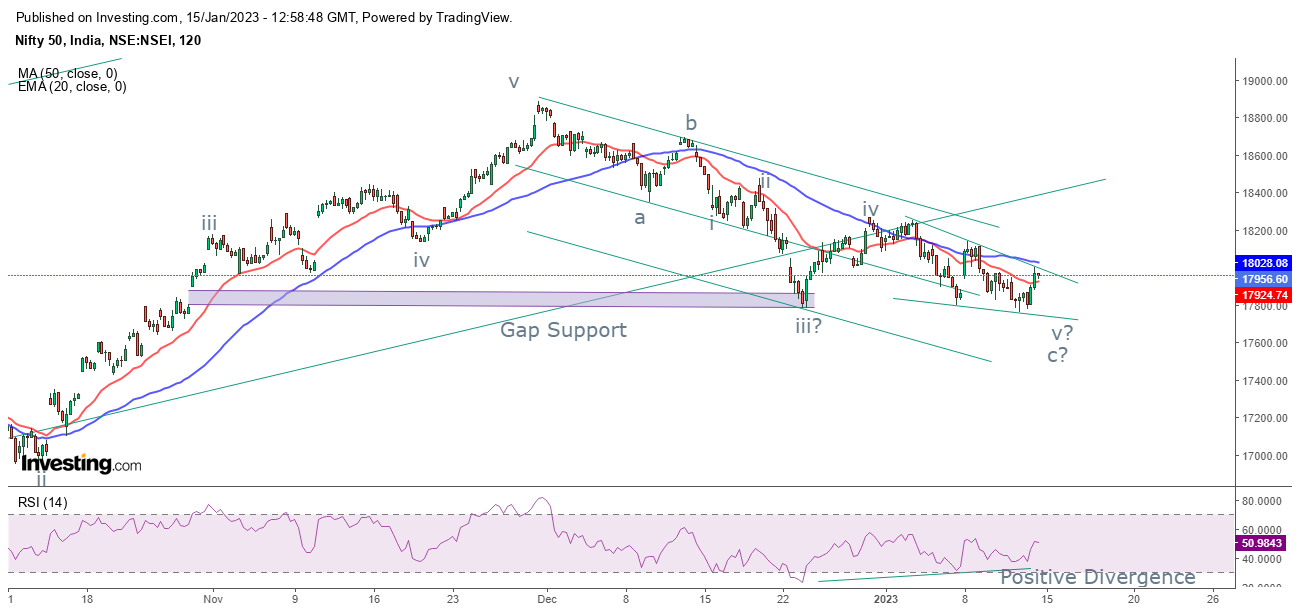
 Nifty 120 mins chart Analysis Nifty continues to move in a stiff range of 18100-17750 levels. It seems there is no directional move for the index. However, there is a high possibility for the benchmark to give a move on the higher side soon. On daily chart prices continue to show in a downtrend where it is placed below both the moving averages 50 SMA and 20 EMA. On the downside there are cluster of supports including Gap support, Bollinger Band support (lower band). As far as prices don't breach this support there is a possibility for it to move higher from current levels. From 120 mins chart, prices are moving in a falling wedge pattern and it seems there is one leg on the downside pending which can drag prices lower till 17800-17750 levels and then it can move towards 18350-18400 levels. RSI on short time frame has started exhibiting positive divergence hinting that limited downside is expected. As per Wave theory, prices are moving in wave v where ending diagonal is formed, in