Bank Nifty Elliott Wave Analysis
Bank Nifty daily chart

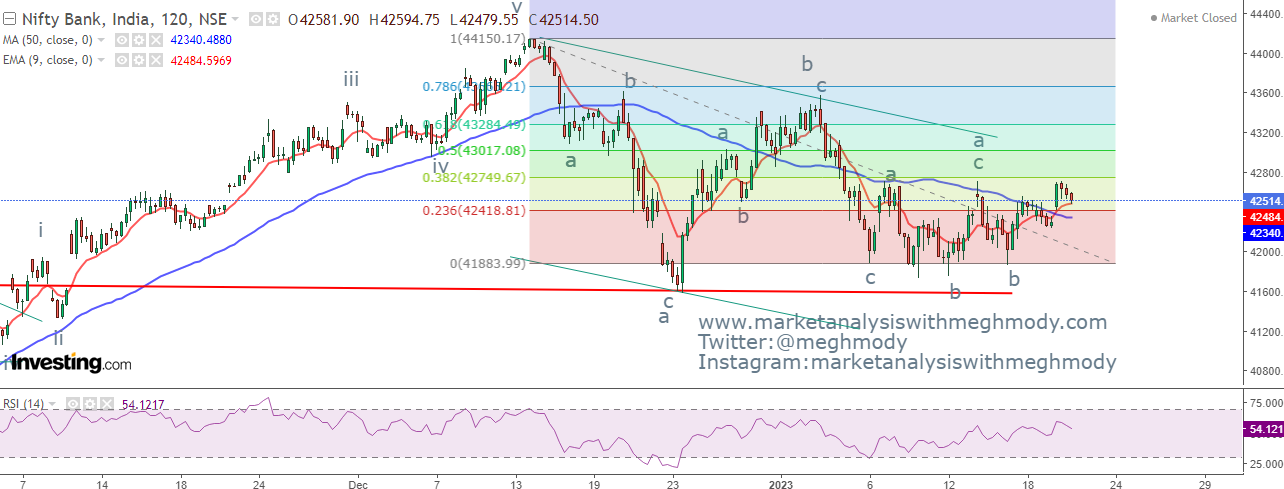
Bank Nifty 120 mins chart
Analysis
As seen in the daily chart, prices continue to move in a sideways to positive trend with bias slightly upside. Previously I had mentioned that Bank Nifty can move towards 43000 and I will continue to hold my target with support intact at 41600.
The level of 43000 is where the resistance of the trend line is placed which can be tested. Any move above this level will open further positive possibilities.
From 120 mins chart, prices after forming a base of 41800 has crossed the level of 42500. Remember I was bullish for the index when it is trading at 42371 and hade mentioned that it will soar towards 43000 levels. RSI has enough vacuum to move towards overbought terrain.
According to wave theory, prices are either moving in wave x which is the ongoing wave or it is part of wave b. One thing is for sure that it is moving slowly and can test 43000 as part of wave x or wave b.
The summation is Bank Nifty is positively poised and can move towards 43000 which was my earlier week target level. I will continue to hold this level and trail my support towards 41800 levels.


Comments