USDJPY Elliott Wave Analysis
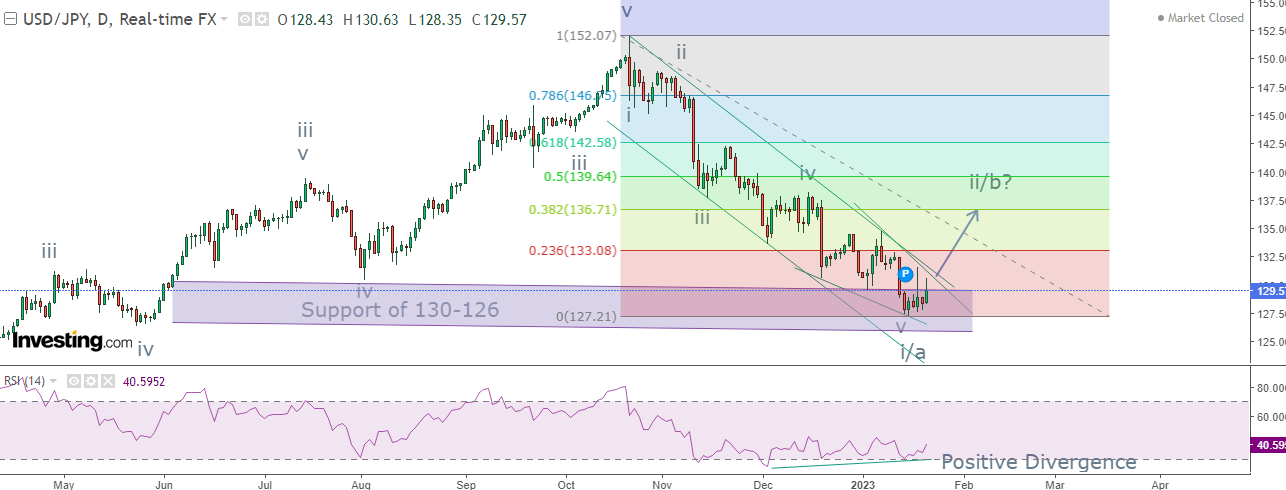
USDJPY daily chart
Analysis
As seen in the above daily chart, prices are moving in a lower highs and lower lows which is a negative formation. However, there is some kind of movement at the bottom which signifies that downside is limited or on the brink to reverse.
At the bottom it is very clear that falling wedge pattern is seen which is an indication that prices can possibly end the downtrend and and up move can start. However, there needs to be a price confirmation for it. RSI has also exhibited positive divergence.
From Waves perspective, prices have completed five waves down in an impulse pattern at 127.8 levels. It is important for the pair to move above 131.4 which can surge price towards 136.8-137 levels.
The summation is USDJPY is set to give a resilience which can soar prices towards 136.8-137 levels, once the level of 131.4 is taken out decisively.


Comments