Posts

USDINR Anticipated Happened

Image
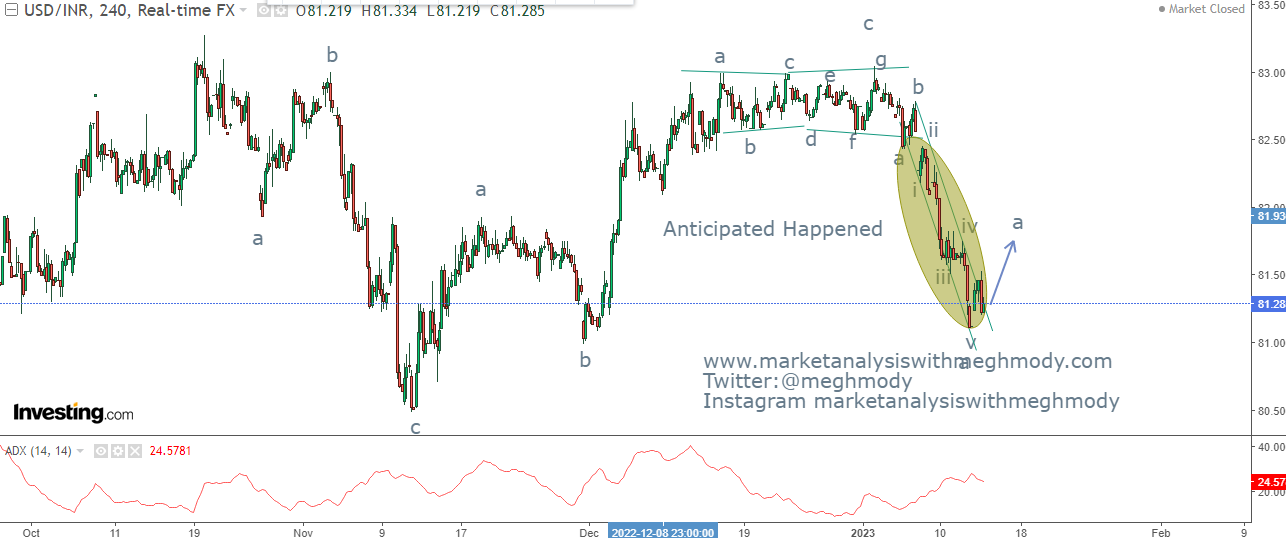
 USDINR 4 hour chart Analysis In my previous update dated 8th January 2023 I had mentioned that, " USDINR is negatively firmly negative and can test the level of 82-81.90 over very short term. Break of this level can test 81.50-81.20 levels over short term." Prices after breaking 82.50 has started falling and reached till 81.80 levels which was also broken decisively thus opening further negative possibilities and achieved my second level of 81.20 thereby fetching 1.60%- Anticipated Happened. To see my previous article on USDINR, click on the below link https://www.marketanalysiswithmeghmody.com/2023/01/usdinr-bow-and-tie-diametric-pattern.html From Waves perspective, prices are moving down in a corrective wave and since it has completed wave c of wave a this will open wave b higher which can go till 81.80 to 82 levels which can be a part of wave a of wave b. The summation is USDINR can move towards 81.80-82 levels over short term.

EURINR 5th Wave starts

Image
 EURINR 4 hour chart spot Analysis In the above chart, the pair is moving in a higher highs and higher lows which is a positive formation. Currently prices are moving precisely in a rising channel and it is near to the support of the channel. On the downside it has a very crucial support of 87.40 levels, which I think will be protected (closing basis). RSI has enough vacuum on the upside which can take prices higher going ahead. From Waves perspective, prices are moving in wave v in which it has completed wave i and possibly wave ii. This will unfold wave iii of wave v higher near till 89.50-89.90 price range. The bias remains positive for the pair. The summation is EURINR will continue to move higher with support of 87.40 (closing basis) and on the upside it can test the price range of 89.50-89.90 levels.

Hang Seng Impulse Wave

Image
 Hang Seng daily chart Analysis Hang Seng was moving precisely in a falling channel and was moving in a falling channel until the channel was broken thereby giving positive sign. Prices not only broke the resistance but is above trading above it which is a positive sign. However, RSI is in overbought zone and there are chances for it to relive from it. As per Wave analysis, prices completed double correction (a-b-c-x-a-b-c) which earlier I thought it could be triple correction. I was wrong in that. After completing wave c of the second correction, prices have started fresh leg on the upside which looks to be impulsive. As of now wave iii of wave iii is in motion and wave iv can unfold soon which can re-test the support of the channel (earlier acting as a resistance). The summation is Hang Seng can move towards 21000-20500 and then resume the uptrend to reach near till 23500-24000 price range.

MCX Copper Anticipated Happened

Image
 MCX Copper daily chart Anticipated Happened  Analysis In my previous update on 12th December 2022 I had mentioned , " MCX Copper is set to move in a positive direction and can test the level of 770-776 over short term."  MCX Copper has made a high of 773.5 on 12th January 2023 thereby surging 9.56%. - Anticipated Happened To read my previous article on MCX Copper, click on the below link https://www.marketanalysiswithmeghmody.com/2022/12/mcx-copper-elliott-wave-5-on-move.html The red metal continues to move in a higher highs and higher lows which is a positive formation. Also it is persisting in a rising channel and has arrived near to the resistance of the channel. The level of 770-776 has multiple resistances and it seems that prices can take a breather from hereon. On ADX front, it is quoting at 33 which indicates that there is a lot of strength in the ongoing uptrend. From Waves perspective, prices are moving in wave iii or it is on the brink to fade. Prices have arrived

Nikkei Neo Wave Diametric Revisited

Image
 Nikkei daily chart Analysis In my previous report dated on 5th December, I had mentioned for Nikkei 225 that, " Nikkei 225 can plunge towards 26800-26500 zone over short term with resistance at 28350." Prices reversed from the resistance and faltered to test my level of 26800-26500 zone thereby achieving 4.60% - Anticipated Happened.  To view my previous article on Nikkei, click on the below mentioned link https://www.marketanalysiswithmeghmody.com/2022/12/nikkei-225-revisited.html The index is currently at support and has shown a reversal near the bottom which is likely to hold. As far as prices are above 25000 levels prices are likely to revisit the levels of 28000 or even higher over short to medium term. The bias for the index now looks to be positive over short- medium and long term.  From Waves perspective, prices have completed Neo Wave diametric pattern where it recently completed wave g which is the last leg of the pattern (a-b-c-d-e-f-g). Now there are high chances

USDINR Bow and Tie Diametric pattern

Image
 USDINR 2 hour chart (spot) Analysis As shown above chart, USDINR pair has been moving in a stiff range of 83-82.60 levels from quite some time. Initially I thought it is moving in an ending diagonal pattern but later it turned out to be another Neo wave pattern. Last week it managed to move down below the important support of 82.50 but on Friday it moved back till 82.76 levels but closed at 82.68 levels. Once the support is broken prices will not sustain higher and as a result it is bound to break further levels on the downside. At present the closest support is at 82-81.90 levels which is the the support of the channel, From waves perspective, prices completed Neo wave bow and tie diametric pattern and has started wave c lower. It took almost more than a month to complete wave b and has opened wave c lower which can test 82-81.9. Only a break below this level will accelerate more selling which can drag prices towards 81.50-81.20 levels. The summation is USDINR is negatively firmly ne

Comex Gold Elliott Wave Aanlysis

Image
 Comex Gold daily chart Analysis From the daily chart, Comex gold is moving in a sideways pattern mainly in a range of $2100 - $1650 levels. Prices are moving in this range and have bounced recently from the support of $1650 levels, currently trading at $1860 levels. As far as the level of $1650 is intact on the downside the bias is positive and can test the upper extreme of the range which is $ 2100. As per Wave theory, prices are moving in a corrective structure and have completed wave (a-b-c) in a regular flat pattern, where it completed wave c at $1650 levels. Now it has opened a fresh leg on the upside which can go near to $2100 or even cross this hindrance. The summation is Comex Gold is positively poised and can move higher from current levels towards $2100 over short to medium term with support placed at $1700 levels.