Nikkei Neo Wave Diametric Revisited
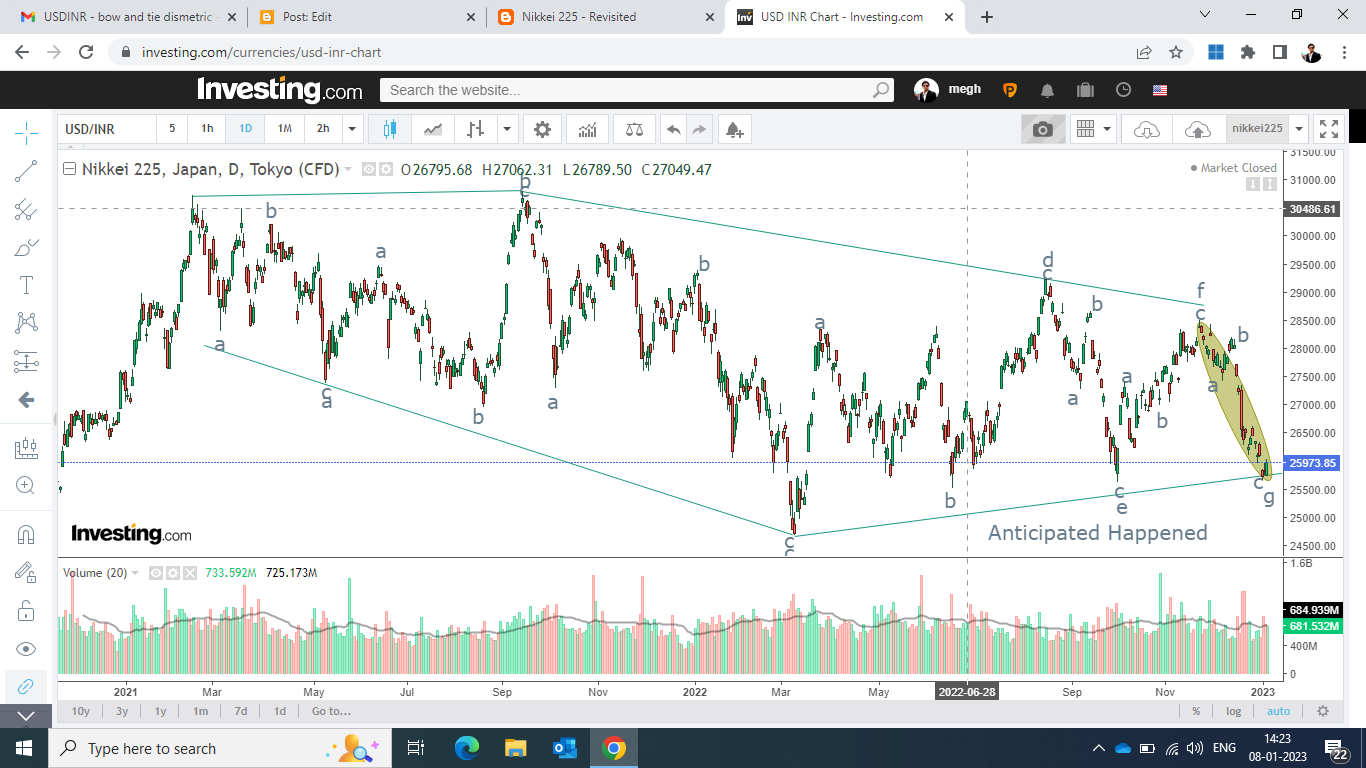
Nikkei daily chart
Analysis
In my previous report dated on 5th December, I had mentioned for Nikkei 225 that, "Nikkei 225 can plunge towards 26800-26500 zone over short term with resistance at 28350."
Prices reversed from the resistance and faltered to test my level of 26800-26500 zone thereby achieving 4.60% - Anticipated Happened.
To view my previous article on Nikkei, click on the below mentioned link
The index is currently at support and has shown a reversal near the bottom which is likely to hold. As far as prices are above 25000 levels prices are likely to revisit the levels of 28000 or even higher over short to medium term. The bias for the index now looks to be positive over short- medium and long term.
From Waves perspective, prices have completed Neo Wave diametric pattern where it recently completed wave g which is the last leg of the pattern (a-b-c-d-e-f-g). Now there are high chances for the index to open fresh leg on the upside which can test 28000 followed by 30000 levels.
The summation is Nikkei 225 is likely to reverse the trend and test the level of 28000 and then 30000 over short to medium term.


Comments