CAC40: Elliott Wave Analysis
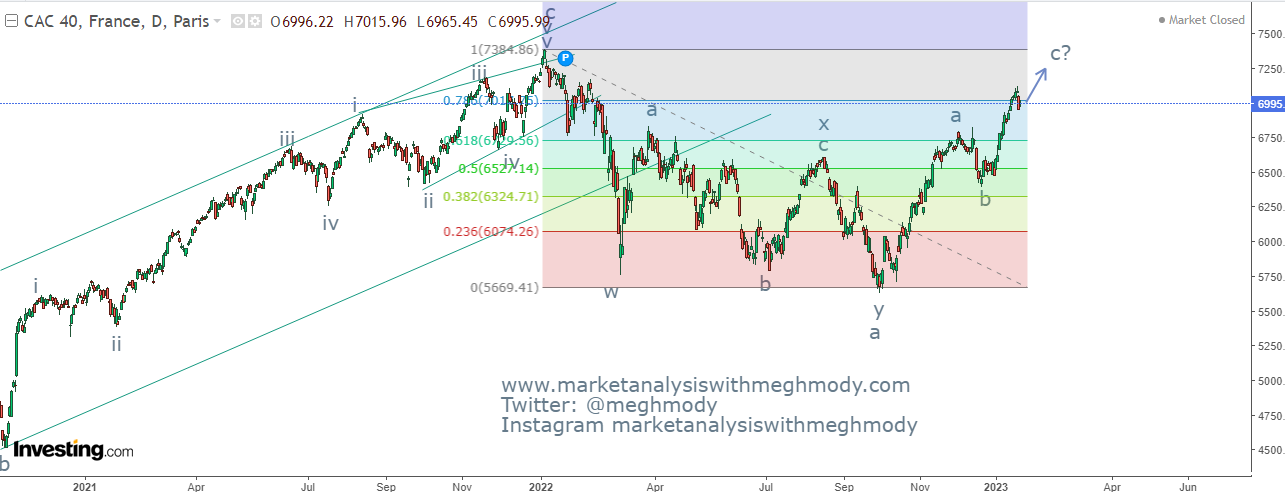
CAC40 daily chart
Analysis
From the above chart, prices are moving in a higher highs and higher lows, it seems that prices have some more vacuum on the higher side which can take prices near to its previous high.
As per Wave theory, the index is moving in a flat pattern (a-b-c) where it completed wave a and it is currently moving in wave b in which it is moving in wave c where last leg of wave c is pending which is wave v.
The summation is CAC40 can move towards 7200-7250 levels from current levels over very short term.


Comments