Shanghai Composite Index (SCI)
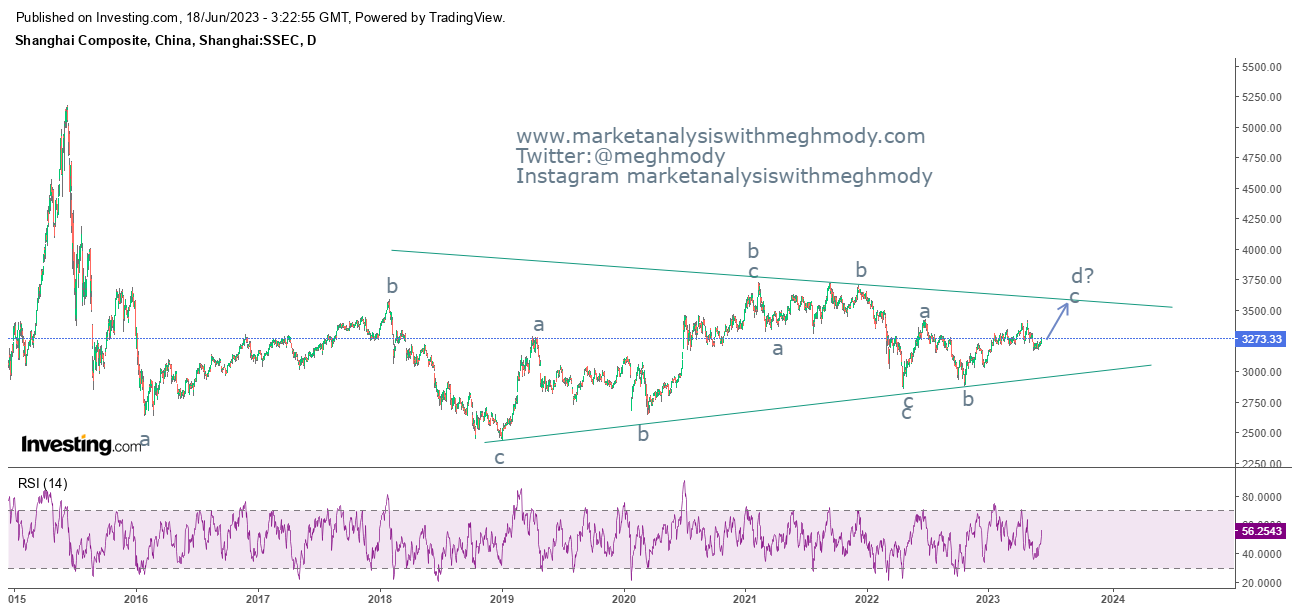
Shanghai Composite Index daily chart
Analysis
From the above daily chart, prices are moving in a sideways direction with no trending or directional move. However, the extremes of the range are well defined which is the upper and lower trend line and looks to be that the index is forming a bigger triangle pattern.
As per Wave theory, prices might be moving in a symmetrical triangle pattern where it has completed wave c and it is currently moving in wave d where wave a and wave b of wave d is over and wave c of wave d is in motion which can move towards 3500-3550 levels over short term.
The summation is Shanghai Composite Index can test 3500-3550 levels over short term as it is positively poised.
Join my Telegram Channel : https://t.me/elliottician1
Join My Twitter handle : https://twitter.com/meghmody?


Comments