Bank Nifty Elliott Wave Analysis
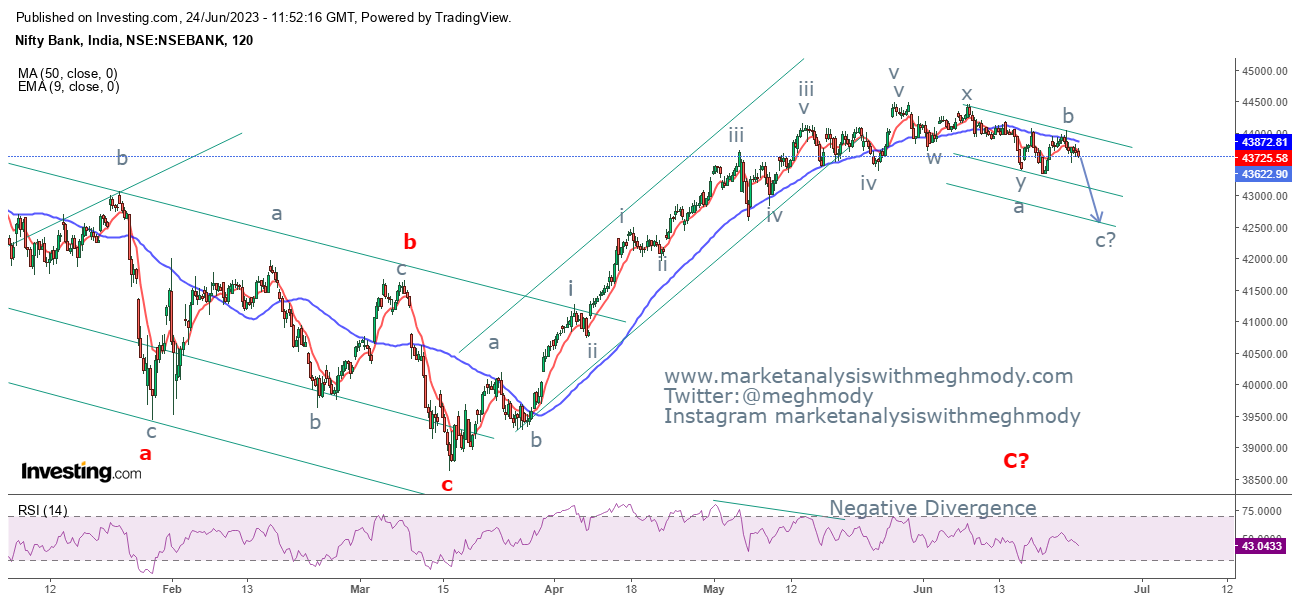
Bank Nifty 2 hour chart
Analysis
As seen in the above chart, the index is moving in a sideways pattern after enormous possibilities applied in understanding the development in the index. However, the fall looks to be corrective rather than impulse. Also price have now come below both the moving averages thereby opening negative possibilities.
As per Elliott Wave, prices have completed wave B on the higher side and has opened wave C on the lower side but it is corrective in nature so it can also be (WXY) pattern or a bigger triangle pattern.
The summation is Bank Nifty is negatively poised and can move down towards 43300 followed by 42600 levels.
Join my Telegram Channel : https://t.me/elliottician1
Join My Twitter handle : https://twitter.com/meghmody?


Comments