Comex Gold
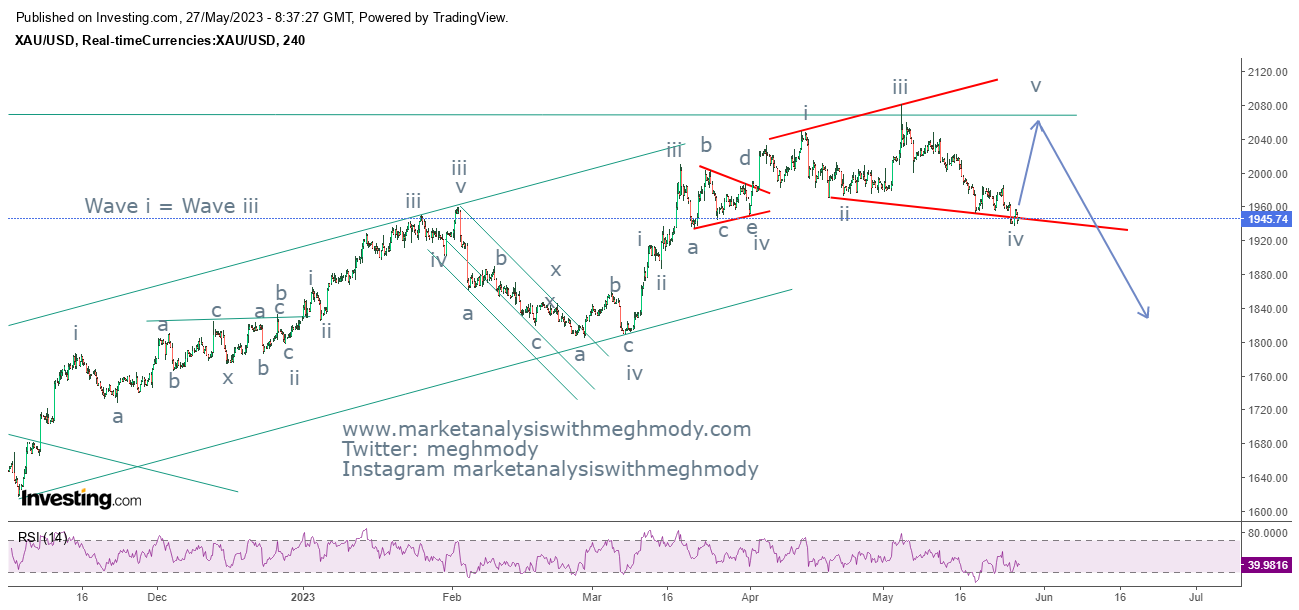
Come Gold 4 hour chart
Analysis
As seen in the above chart, prices broke the important support of $1950 which was crucial, but the yellow metal continues to remain near to it and has not gone down decisively gives us another indication that there can be another leg on the upside. This leg can cross its previous high or can fail as well. I think truncation or failure is possible. As EURUSD continues to tumble, Gold which moves in sync with it can move down from there as well.
RSI is showing positive divergence and can take prices higher which can go till $2000-2040 levels over very short term.
As per wave theory, prices are moving in expanding diagonal pattern and one more leg on the upside is pending which can take prices near to the above mentioned range.
The summation is Comex Gold is expected to move towards $2000-2040 levels over short term.
Join my Telegram Channel : https://t.me/elliottician1
Join My Twitter handle : https://twitter.com/meghmody?


Comments