Posts

Nifty: Start of correction

Image
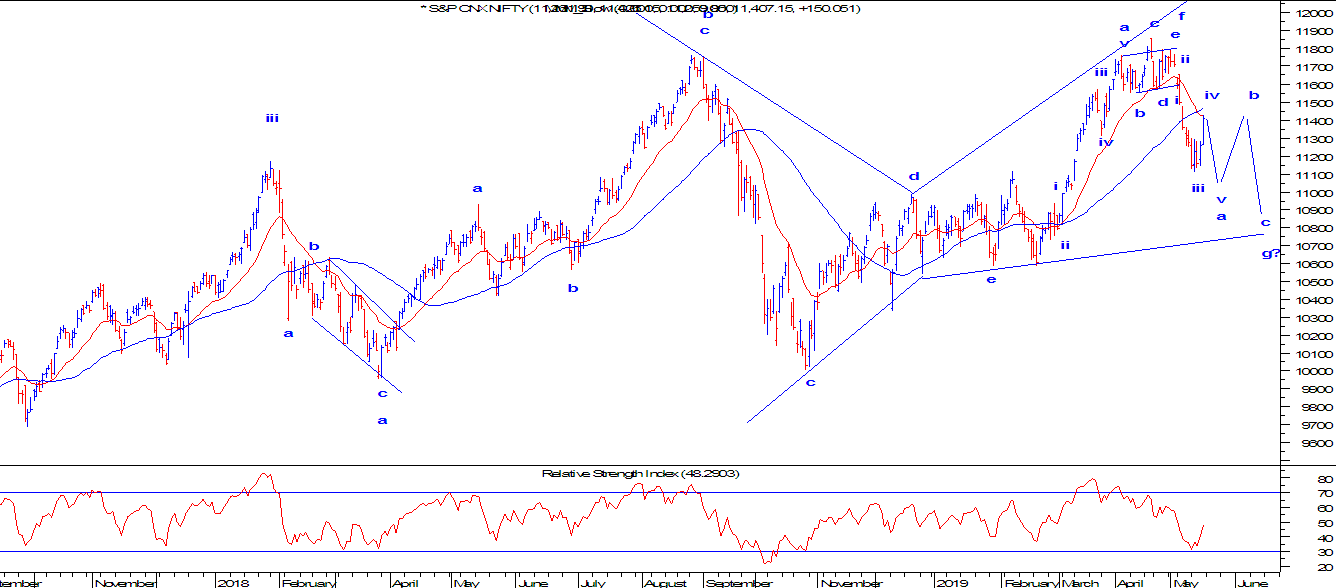
Nifty Hourly chart In the above hourly chart, prices are moving in a falling black channel. Last week it faced the resistance of 11850 and reversed falling more than 100 points on Friday. This indicates that the short term trend is negative From wave perspective after completing five waves up, prices are moving in a complex correction (a-b-c-x-a-b-c). It recently completed wave x and has started falling in the form of wave a of second correction. This fall can drag prices lower till 11550 levels where the support of the gap is placed along with 20 weekly EMA. The summation is prices are negatively poised and is on the verge to fall near 11550 levels. The resistance is at 11850 levels, any move above this level will change the trend.

EURINR: Flat Pattern

Image
EURINR Weekly Continuous Contract From the above weekly chart of EURINR, prices are moving down by breaking its previous low which indicates that prices are negatively poised and can drag down further. A classical bearish head and shoulder pattern is formed (shown by rising black line). Prices are trading below this neckline. Last week it tested the neckline but failed to trade above it, indicating supply pressure is intense. The target as per the pattern comes to 72 levels. As per wave theory, prices completed wave b in a three wave structure (a-b-c) and retraced 80% of the previous wave a, indicating that it is a flat pattern. This means wave c is pending on the downside. Prices have started wave c lower and can move down near to 72 levels. In short, as far as prices trade in a falling black channel, the bias is negative as it can tumble near till 72 levels with resistance at 81. It is not difficult to predict the market by using advance technical analysis, bu

MCX Silver: Bow and Tie Diametric Pattern

Image
MCX Silver Weekly Continuous chart In the above weekly chart of Silver, from past two weeks prices are forming a doji pattern which indicates that the previous trend which is bearish is indecisive. This means that further down move in Silver is least likely. If it will halt at current levels, there are high chances for prices to reverse and can move higher above its previous high of 37800 levels. As per wave theory, prices are moving in Neo wave bow and tie diametric pattern which has seven legs within (a-b-c-d-e-f-g). It is seen that wave g which is the last leg has completed and will reverse soon. In short, a reversal in prices are likely which can take prices higher till 38000 in coming weeks with support at 35200 levels.

MCX Copper: All set to tumble

Image
MCX Copper Daily continuous contract In the daily chart,   prices are moving in a range drawn by two horizontal blue lines. The range has a support of 400 and resistance at 470. It is likely that prices will break the support and move lower. RSI is negatively poised as it is in the oversold zone. Once the level of 400 is broken, selling pressure will intensify which can drag prices further lower. From Wave perspective, after completing wave b in a flat pattern , prices are moving down in wave c of wave b and can move below wave a placed at 402.5 levels. Currently the red metal is moving in wave iii of wave c of wave b which may or may not be the longest. In short, Copper is expected to fall and test the level of 390-385 levels in near term. The bias is firmly negative.

GBPINR : Extracting Triangle, Neo Wave

Image
GBPINR Weekly Continuous chart In the above weekly chart, prices are trading in a sideways pattern shown by two horizontal lines. As far as price persists in the range of 98-88 levels no trending move is expected. Prices which were moving in a rising black channel has eventually given a bearish break by moving below it which opens negative possibilities. Weekly RSI is below 50 which is a negative sign. Break of 87 levels will start a lower high and lower low formation which will change the trend from positive to negative. Prices will continue to move lower going ahead but there is no confirmation of price. For price confirmation it is important that 88 levels is broken decisively. From Wave perspective, cable is moving in an extracting triangle in wave b and it is on the brink to complete this wave which will open wave c down dragging prices way lower till 78 levels in near term. In short, prices will be negatively poised once the level of 88 is broken which

Nifty at one higher degree and forecasting through Neo wave

Image
Nifty Daily Chart Last week I had written an article on Nifty that the selling will intensify ahead of election results. Nifty did made a new low and continued the downtrend. However, in the last two days of the week Nifty closed above 11400 levels. This article on Nifty will concentrate on one higher degree which moreover looks like a sideways pattern. The rage of this pattern is is of 11600 and 11100 on the downside. So it is better to go with an option strategy more likely of a Straddle, which is to buy call and put of same strike price and expiry.                                               Call           ATM             Put                                                 1096           11400            58 A bearish crossover is seen in Nifty. An impulse fall is still intact with wave iv on the brink to complete and wave v to start anytime soon. Also the bigger wave looks to be a bow and tie diametric in which last leg of diametric is ongoing. In this case wa

Nifty: Selling to intensify ahead of the election results.

Image
Nifty Daily Chart Nifty has outperformed many  Asian markets from the start of 2019. There can be many reasons like elections, IIP and CPI data. However last week market witnessed heavy selling which was accompanied by FII selling as well.  Technically speaking, markets which were moving in a higher highs and higher lows have discontinued this formation. Prices are also trading below both the short term moving averages i.e 20 EMA (red) and 50 SMA (blue) but there is no bearish crossover yet. All this indicates that market is in bear mode and can slip further. From Wave perspective, prices progressed in a three wave formation which was corrective in nature (W-X-Y) In wave Y there was a extracting triangle marked as (a-b-c-d-e). The current fall looks to be an impulse and can move down till 11100 levels where the support of the trendline is placed. It is likely that this trend line will be broken. As of now the index is moving in wave iii. It is not difficult to predict