MCX Copper: All set to tumble
MCX Copper Daily continuous contract
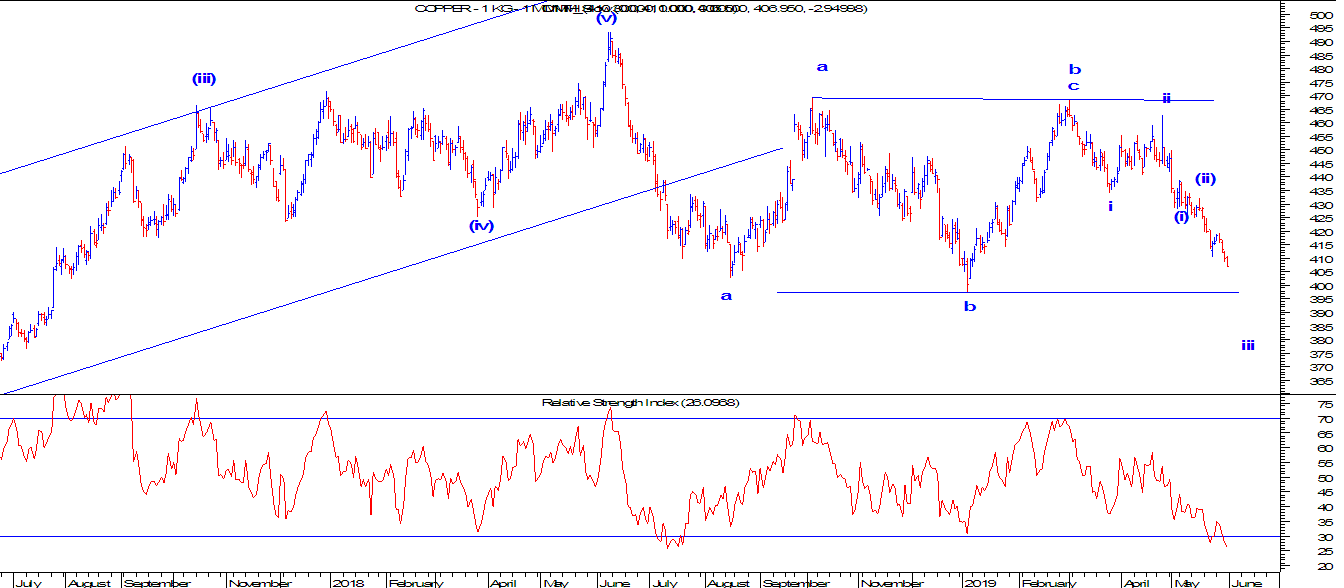
In the daily chart, prices are moving in a range
drawn by two horizontal blue lines. The range has a support of 400 and
resistance at 470. It is likely that prices will break the support and move
lower.
RSI is negatively poised as it is in the oversold zone. Once the level of 400 is broken, selling pressure will intensify
which can drag prices further lower.
From Wave perspective, after completing wave b in a flat pattern ,
prices are moving down in wave c of wave b and can move below wave a placed at
402.5 levels. Currently the red metal is moving in wave iii of wave c of wave b
which may or may not be the longest.
In short, Copper is expected to fall and test the level of 390-385
levels in near term. The bias is firmly negative.


Comments