DLF: Elliott Wave Analysis
DLF hourly chart
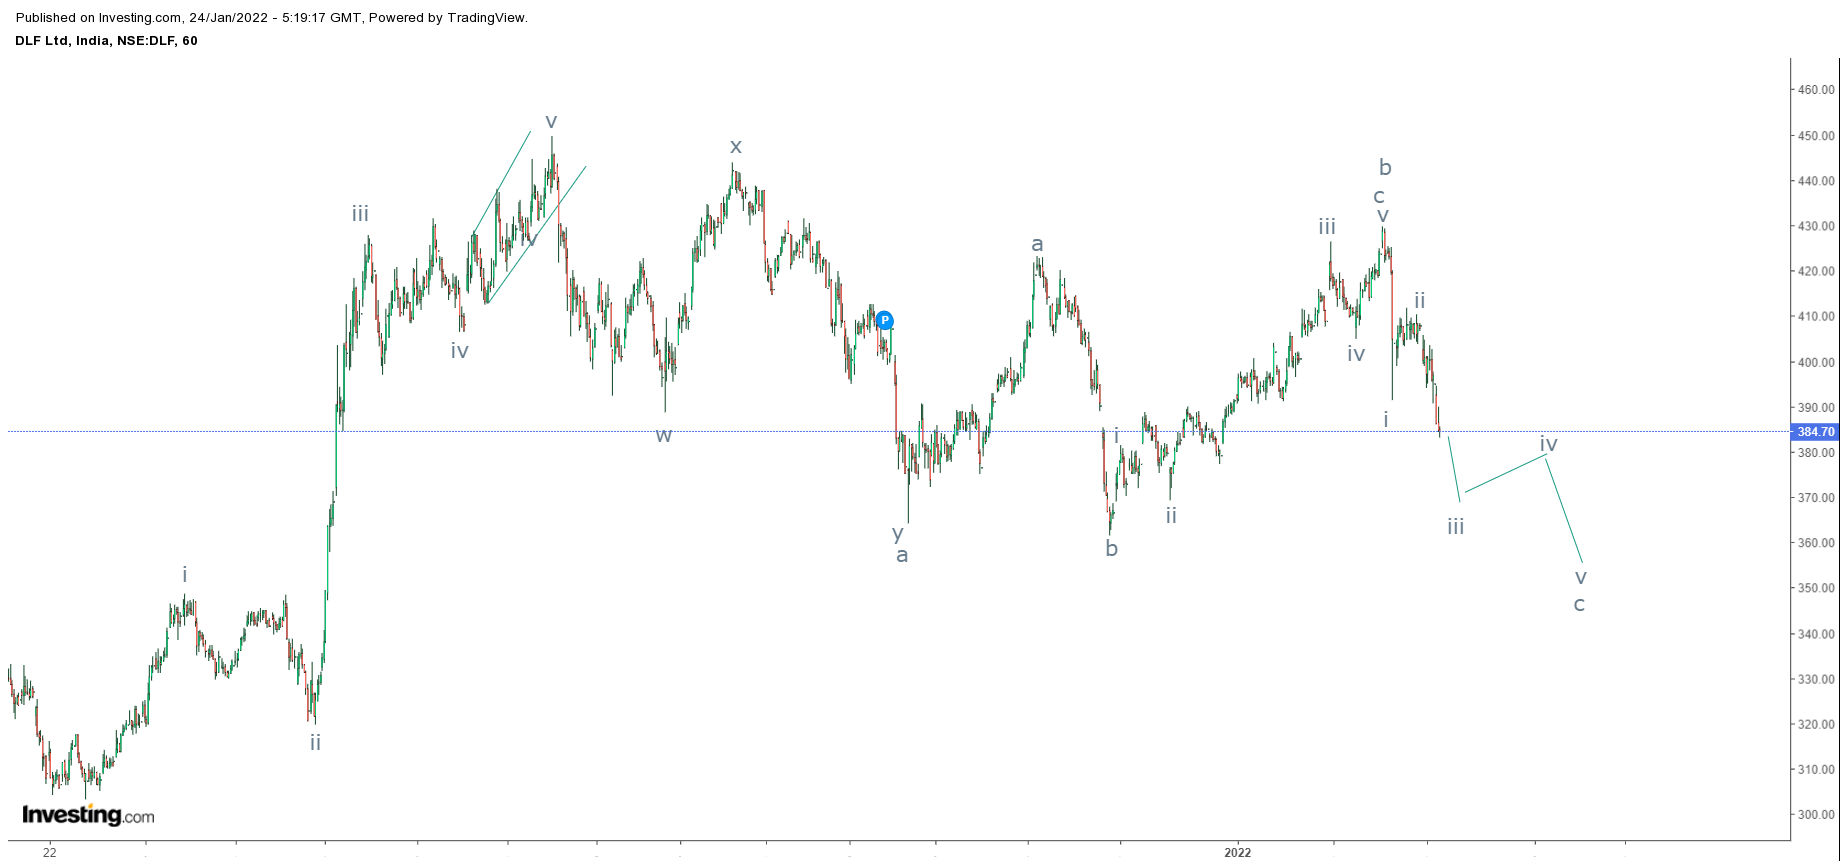
From the above chart, prices are moving in a sideways direction, particularly in the range of 450-350 levels. Recently it faced the resistance of the range and it is falling which can lead prices towards the support of the range.
As per wave theory, prices are moving in flat pattern, where the first fall was complex correction ended in wave a thereafter it went up to complete wave b (a-b-c) perfect corrective pattern. Now it is falling in an impulse fashion to complete wave c which can move down in a range of 360-350 levels.
The summation is DLF is negatively poised and can falter towards 360-350 levels over short term.


Comments