Shiba Inu: Road Ahead with Elliott Wave Analysis
ShibaInu/INR hourly chart
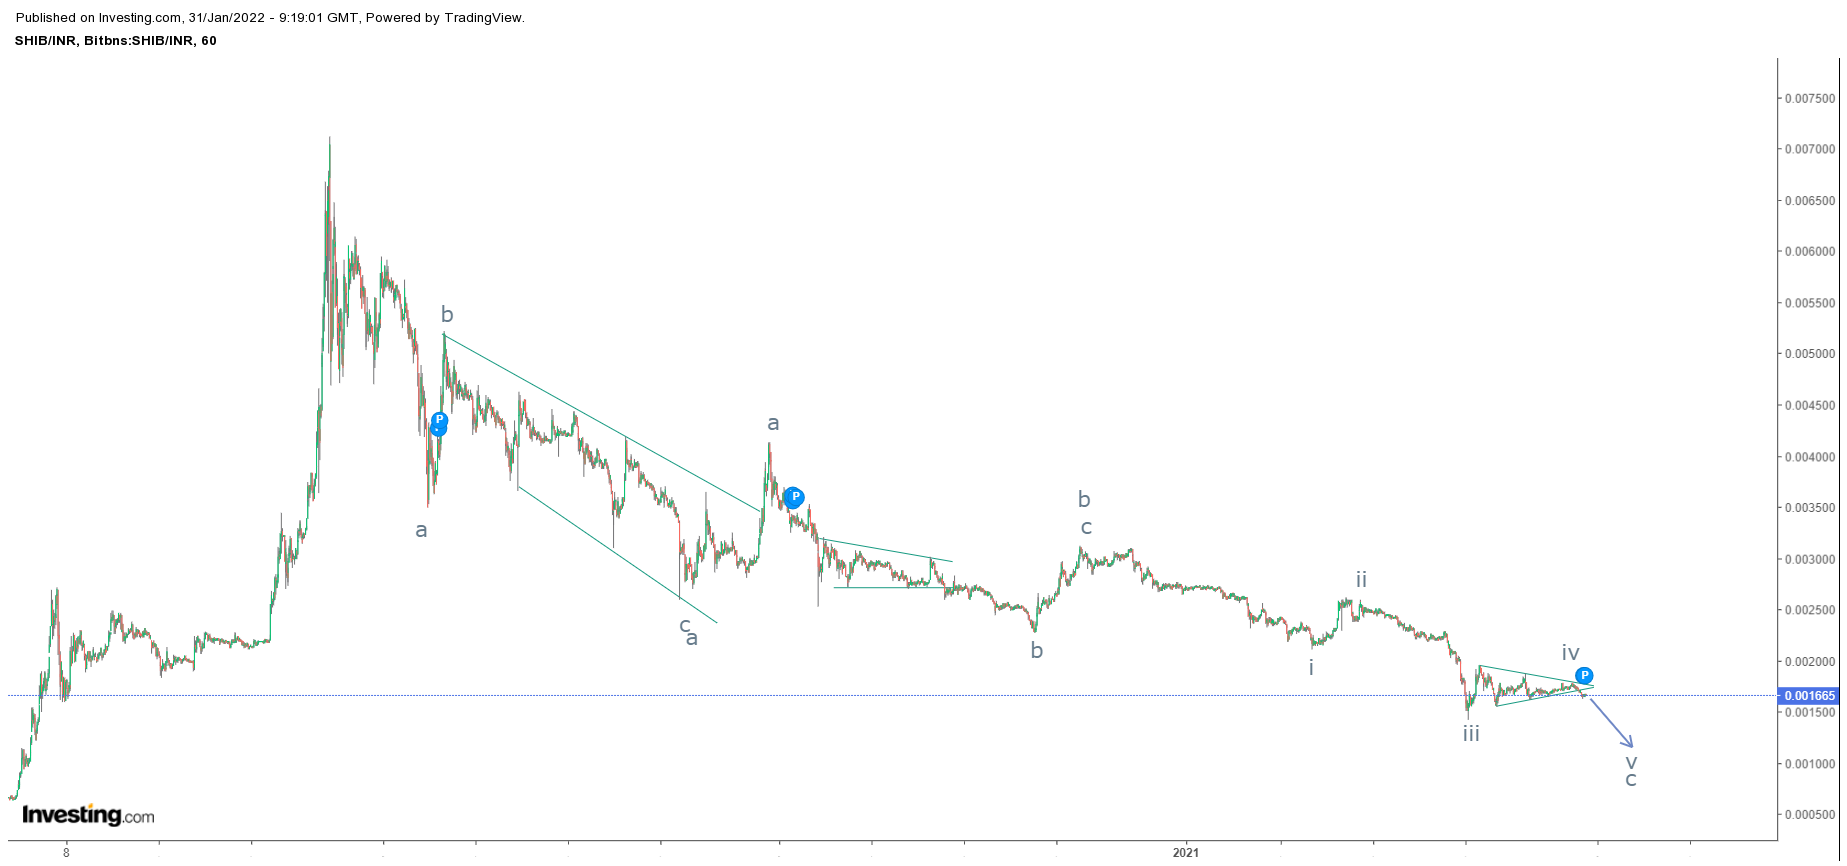
From Waves perspective, prices are moving in a corrective pattern (a-b-c) where wave a and wave b in running irregular flat is completed, wave c is in making where it has completed wave i to wave iv and wave v is pending. Wave iv is in triangle which got completed today, this opens wave v lower which can test 0.000755 INR
The summation is SHIBAINU is all set to plunge towards 0.000755 over short to medium term.


Comments