Bitcoin: Elliott Wave Analysis
Bitcoin daily chart
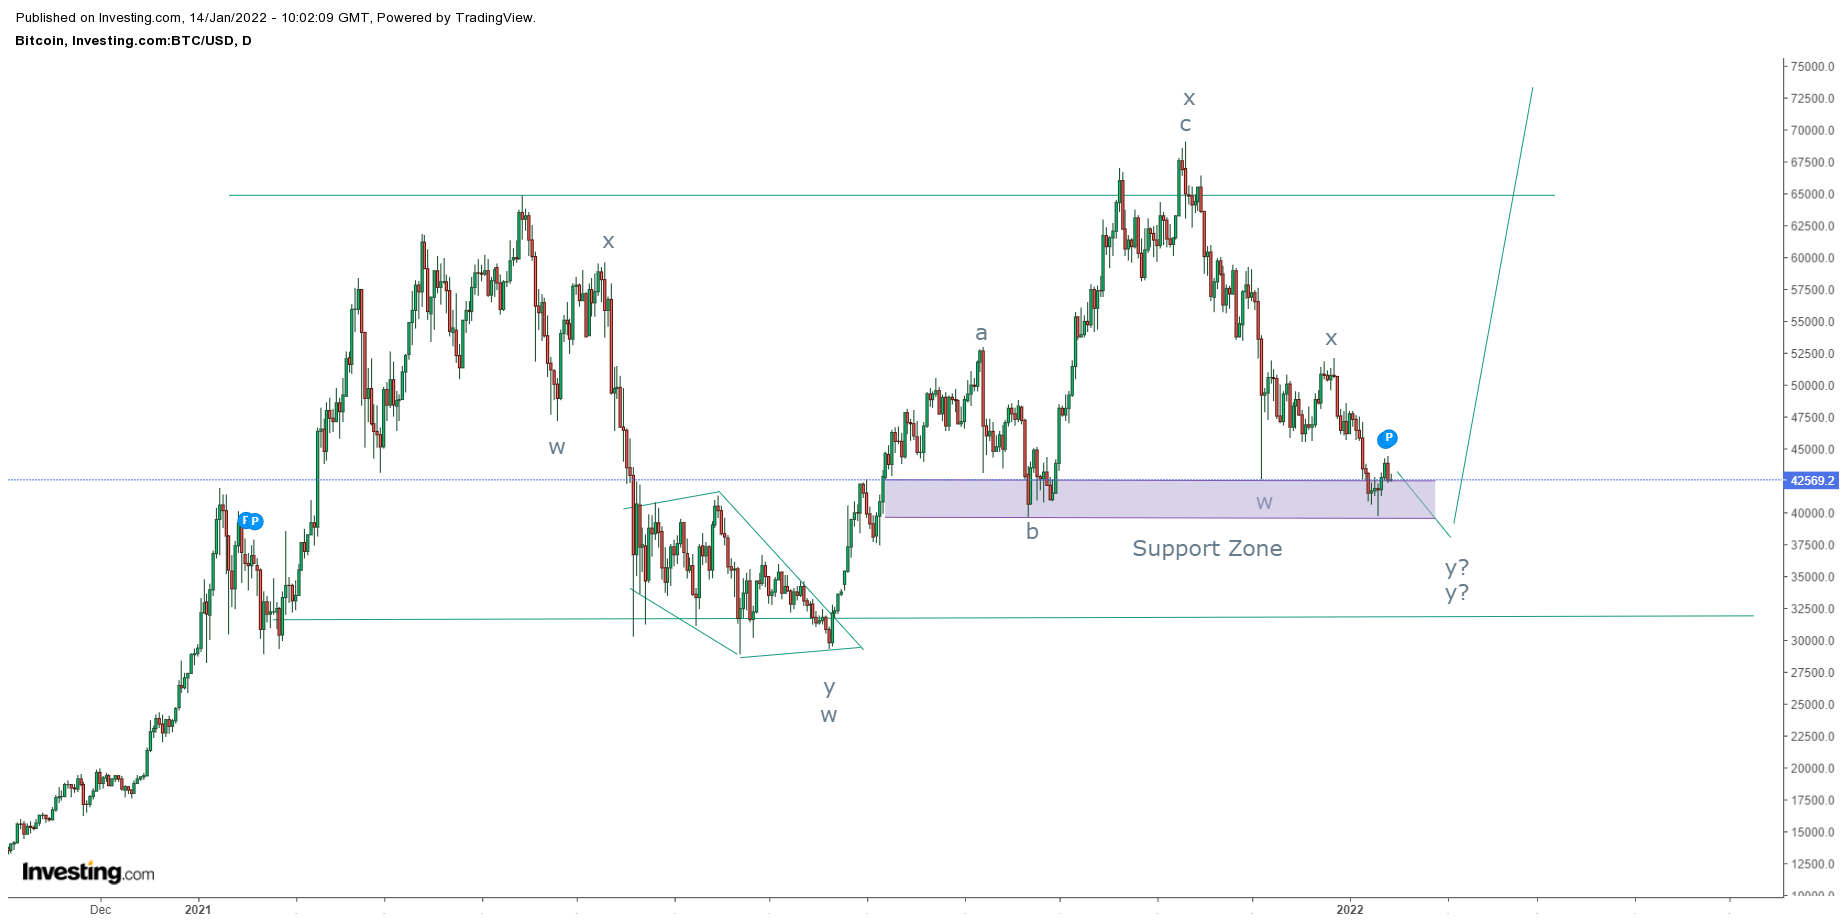
As shown in the above chart, Bitcoin is moving in a range of $65000-$35000 levels and it seems that prices will continue to move in this range once the lower extreme of the range is tested.
To understand it more precisely, it is better to know where the support and resistance levels are placed. Currently, prices are hovering near crucial support of $40000 levels (shaded area). As far as this level is intact there is a limited downside. However, decisive break of the above mentioned level will plunge price towards $35000 over short term.
From Waves perspective, prices are moving in a irregular flat pattern but with slight complication. So this cannot be a irregular flat pattern as I can see only (3-3-3) so I will open running triangle as my other favorable probability. If triangle is not formed I will sum up with (w-x-y). I will monitor the counts and will keep you all posted. Also the final outcome after the pattern is complete will lead Bitcoin to new highs minimum $75000.
The summation is Bitcoin is firmly positive as it can soar till $75000 over medium term but will consume time.


Comments