GBPINR: Triple Correction?
GBPINR Spot daily chart
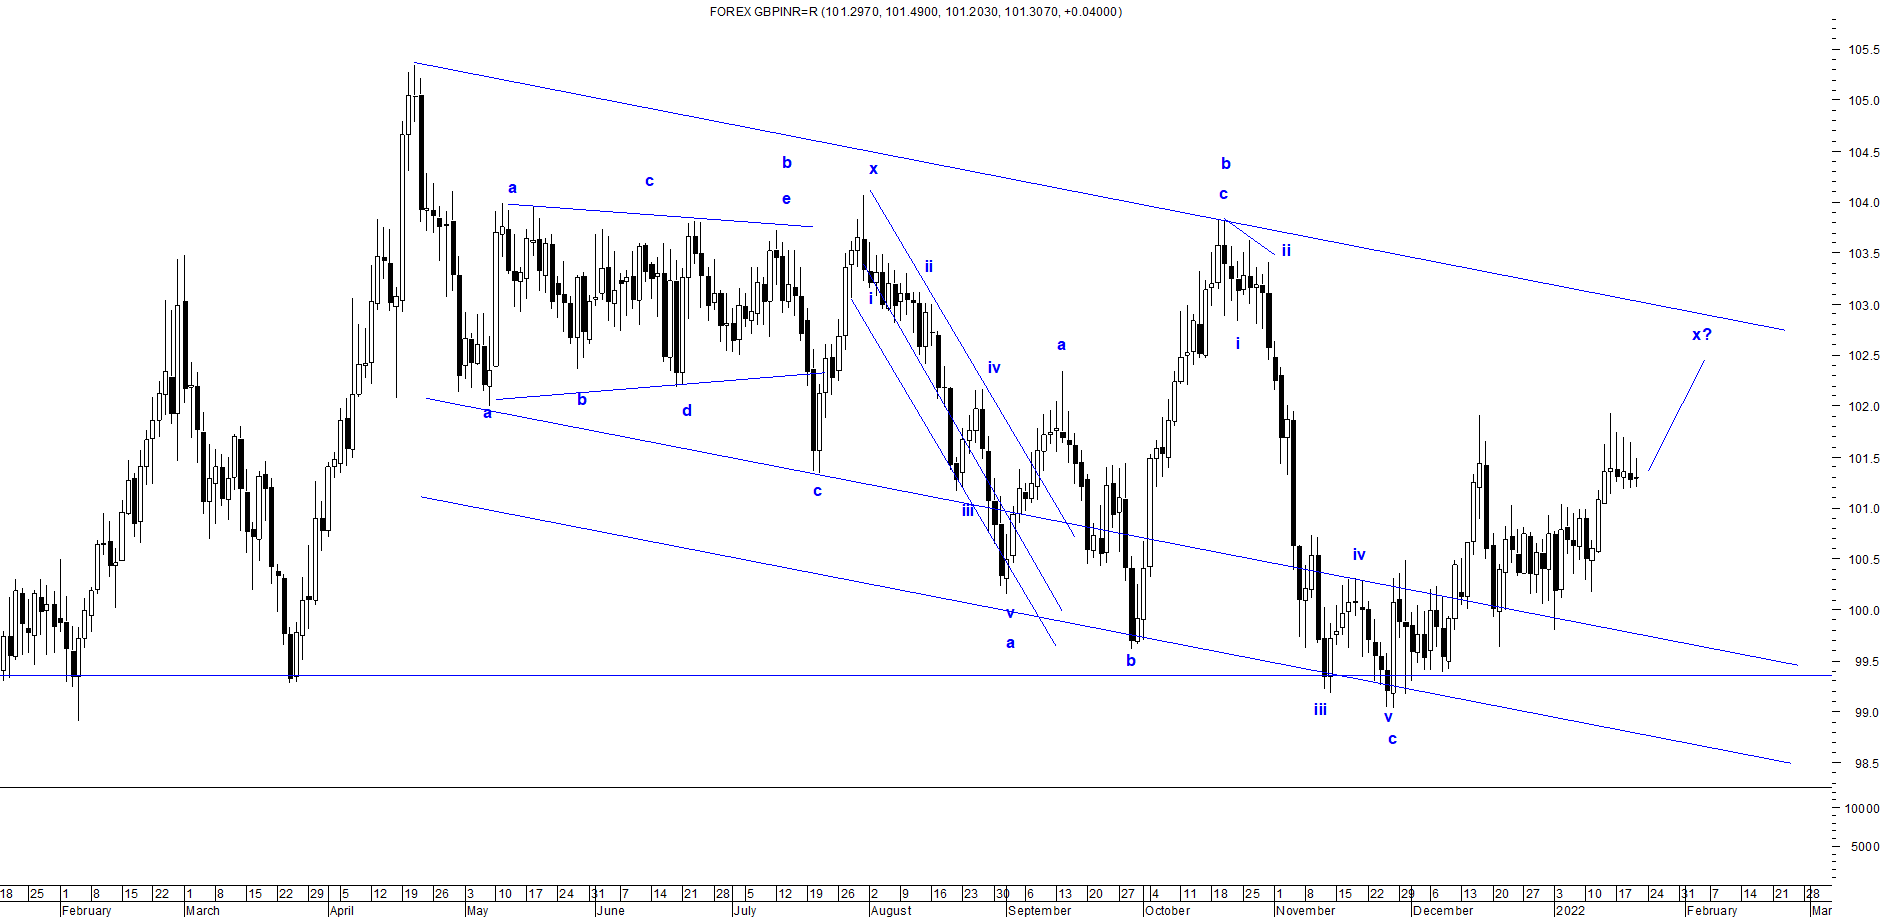
As shown in the above chart, prices are moving in a falling channel which gives an indication that the trend is down. Recently, cable has shown resilience from the support of the channel which can move back towards the resistance of the pattern. many analysts believe that the uptick in price is due to rise in inflation in UK but technically it was hinting ahead of time.
From Waves perspective, prices are moving in a double correction which can now be turned into triple correction (a-b-c-x-a-b-c-x-a-b-c). Currently prices are in the second wave x and it is still forming which can move till 102-102.5 (spot).
The summation is GBPINR is mildly positive and can fin resistance at 102-102.5 levels over short term.


Comments