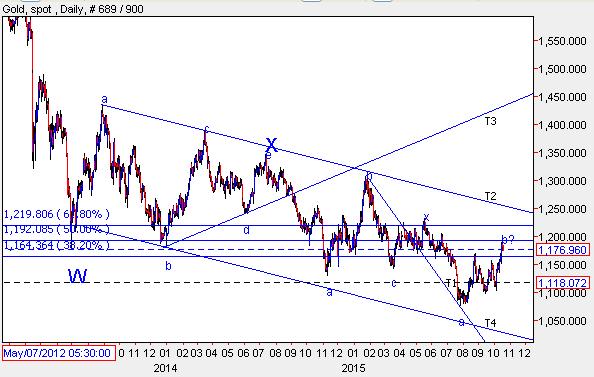
Gold in a complex correction pattern.
From the top of $1920 marked on 5th September 2011 prices failed to sustain at higher levels, eventually resulting in a crash. Currently it is trading at its three month high from the bottom of $1076 at $1176 per ounce, but it seems that this rally will fail going ahead.
Technically speaking, gold is moving in a negative direction forming a lower high and lower trough. Prices are also moving precisely in a downward sloping channel. The recent bounce have already retraced 50% of the previous fall, it can also retrace 61.8% placed at 1219 levels which is closer to the resistance of the channel . However, the momentum will fail to support prices which will mark a reversal.
As per wave theory, prices are moving in a complex correction (W-X-Y) within which Wave W was a three wave pattern, wave X was a triangle and wave Y which is ongoing seems to be a double correction (a-b-c-x-a-b-c). Currently it is moving in wave c of wave b of the second correction in which it has completed the third wave of impulse, a sideways move followed by a minor leg on the upside will terminate the current leg. Completion on wave b will open the possibility of wave c of wave Y on the downside dragging prices near till $1076 levels or even lower.
In short, a decisive move below $1155 will open the possibility of $1076 on the downside with the resistance of $1230.
Gold Spot Daily Chart :-
Disclaimer: Please do not circulate this report to Clients and others. The motive for this short term update was to make aware of various patterns and its implications and how it can be used for forecasting various asset classes. Do not trade on this update or take any positions based on the above mentioned view.


Comments