Nifty in an expanding triangle pattern ( Elliott Wave Analysis)
The recent bounce in Nifty was quite surprising for many traders especially after global markets were melting down on the back of speculation over rate hike by Fed and slow down in China. Nifty failed to move down further, finding support at the lower trend line placed at 7540 of the channel and marked a high of 8243 levels.
Currently the rally seems to exhaust as it is moving in a expanding triangle pattern. A triangle has five legs, each are corrective in nature (3-3-3-3-3). Today it started its fifth leg which can move above 8243 or can even fail to cross it. A triangle at the top indicates that the rally is over, as the entire upmove itself is corrective in nature (w-x-y).
Nifty needs to break the level of 8100 decisively for negative possibilities to open. The thrust of a triangle is always sharp and will retrace faster. The possibility for a trend reversal is likely in Nifty.
In short, a trend reversal in Nifty is expected only if prices move below 8100 at much faster pace. If so the possibility for the index to test the price zone of 7200-7500 is very much likely.
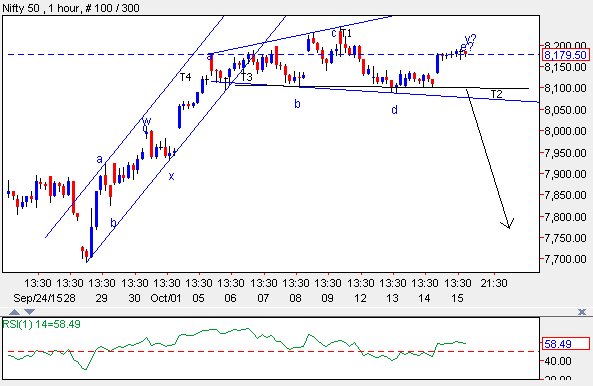
Nifty 60 mins chart:-
Disclaimer: Please do not circulate this report to Clients and others. The motive for this short term update was to make aware of various patterns and its implications and how it can be used for forecasting various asset classes. Do not trade on this update or take any positions based on the above mentioned view.


Comments