MCX Zinc Mini Elliott Wave forecast
MCX Zinc M daily chart
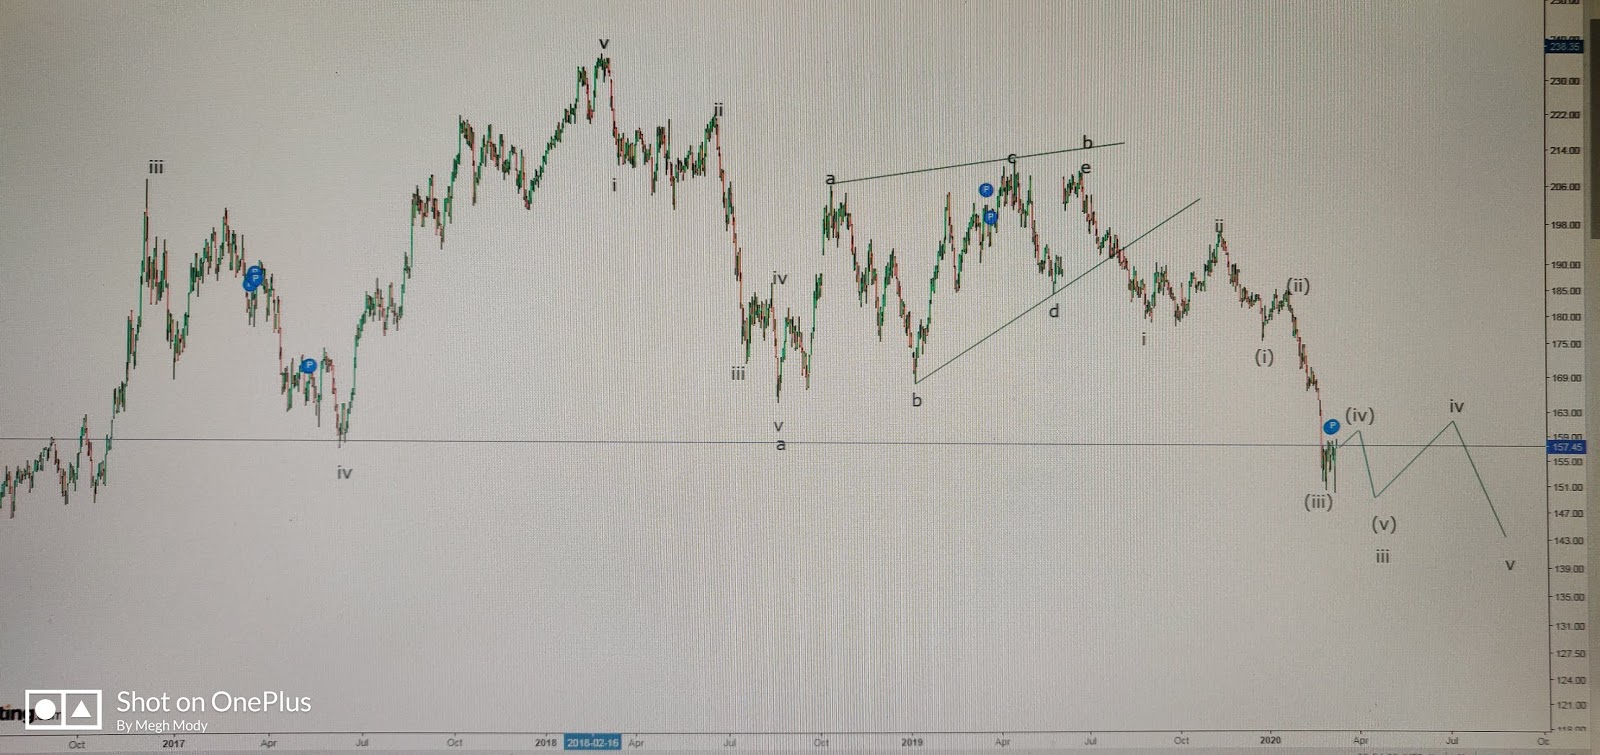
Zinc mini is moving in a lower high and lower low formation which is a negative sign. Also to notice prices have give a bearish Head and Shoulder break, this opening negative possibilities.
From wave perspective, prices are moving in wave c of wave (a-b-c). Wave c is impulse in nature, in which it is moving in wave iii which is extended. After completing wave (iv) of wave iii it will break it's previous low of 149.90 and complete wave iii then wave iv higher will start which can soar prices near till cluster of resistances placed at 159-160 and then again wave v of wave c will move near till 147-145 range.


Comments
Midcaps