USDINR: Topping process underway with ElliottWave forecast
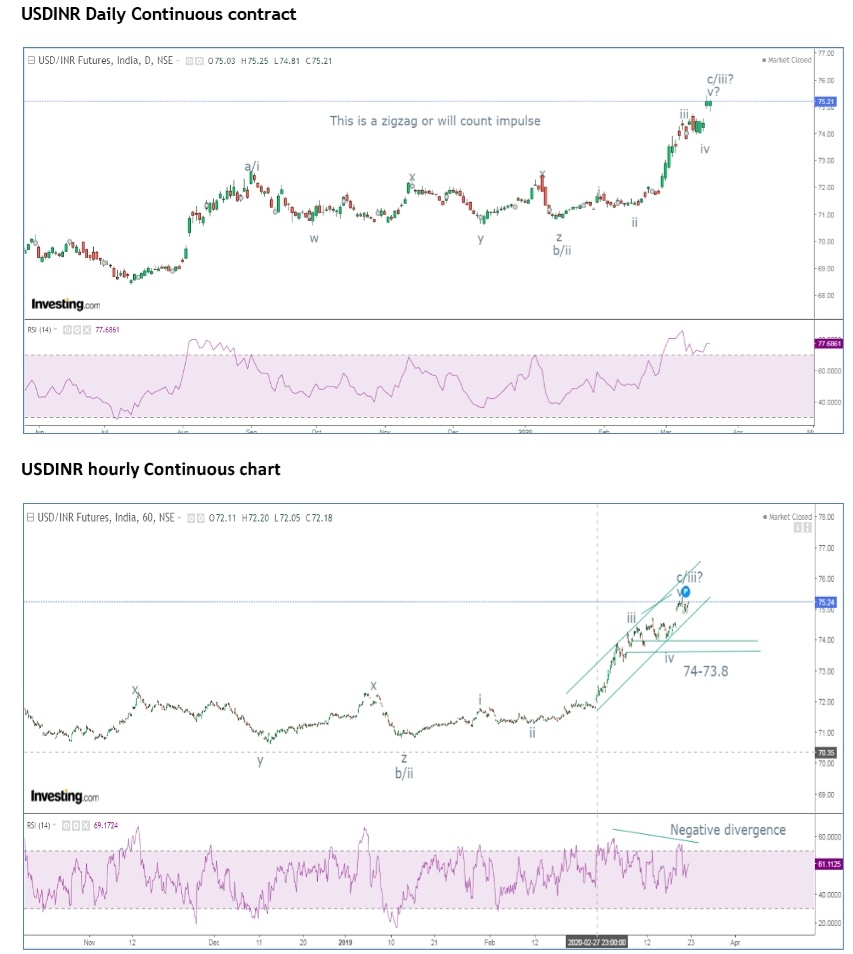
As shown in the daily chart of USDINR, prices continue to move in a positive direction as by crossing its previous highs which is a positive sign. Last week it failed to move below 73.8 and as a result prices moved higher, thus indicating that the trend is positive. I would recommend to stay cautiously positive for this pair.
In hourly chart, Prices are moving in a rising channel, as far as prices persist in this channel the bias continues to be positive. Only breach of this channel will on the downside will open negative possibilities. It is imperative that prices break the level of 74.55-74.5 which can drag prices lower. RSI continues to exhibit negative divergence.
As per wave theory USDINR is either moving in a zigzag pattern or an impulse fashion. The best way to know is its internal counts. As of now wave v of wave c/iii has started and can end soon as it is near to 100% of wave a/i. Once this ends and the level of 74.55-74.5 is broken, prices will start new leg down.
The summation is USDINR has a resistance at 75.55-75.6 and a crucial support at 74.55-74.5. The possibility for prices to break the support is likely which can drag it near till 74-73.8.


Comments