Nikkei 225 Elliott Wave Analysis
Nikkei 225 daily chart
Analysis
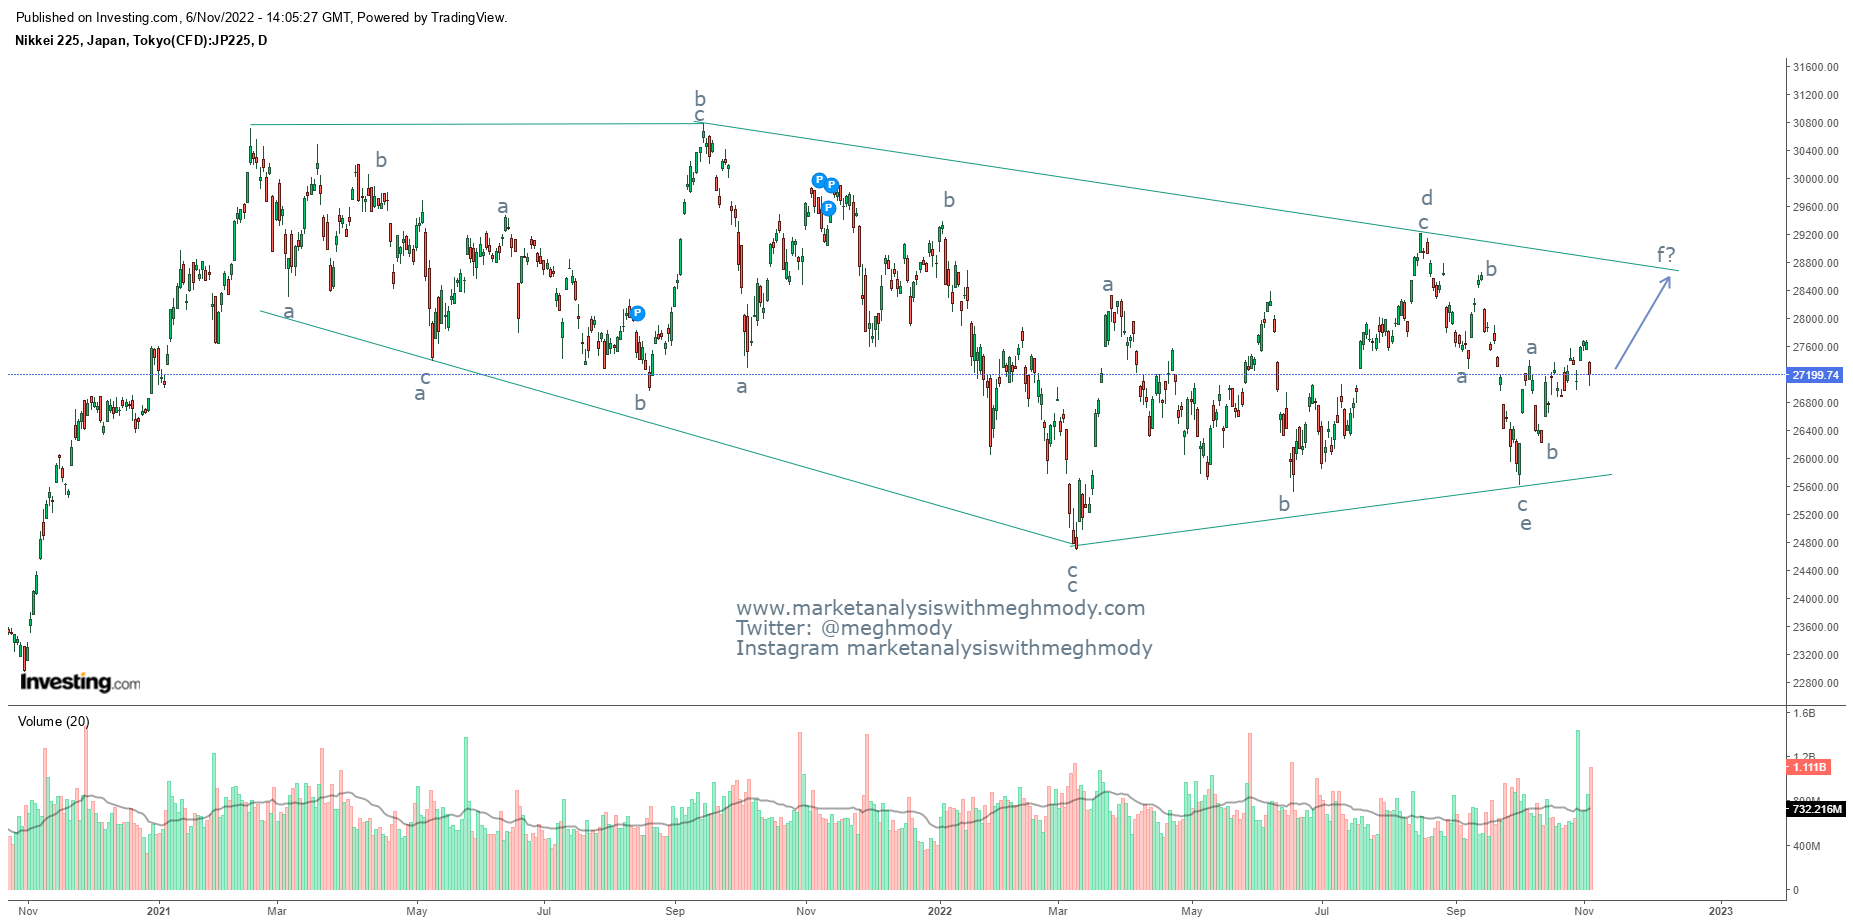
As shown in the above
chart, Nikkei is moving directionless especially after making high in February
2021. As per traditional technicals, the index is moving in a diamond shape
pattern and it seems that there can be a bounce which can take prices near to
28000-28400 levels
The pickup in volumes
recently has indicated that prices are well supported at the bottoms placed at 25500
levels.
From Waves
perspective, the index is moving in a diametric pattern which has seven legs in
it (a-b-c-d-e-f-g). Recently it has completed wave e near 25500 levels and it
has now unfolded wave f on the upside which can go till 28000-28400 price
range.
The summation is Nikkei
225 is positively poised can move near till 28000-28400 resistance zone over
short term.


Comments