MCX Crude Oil and Elliott Wave Analysis
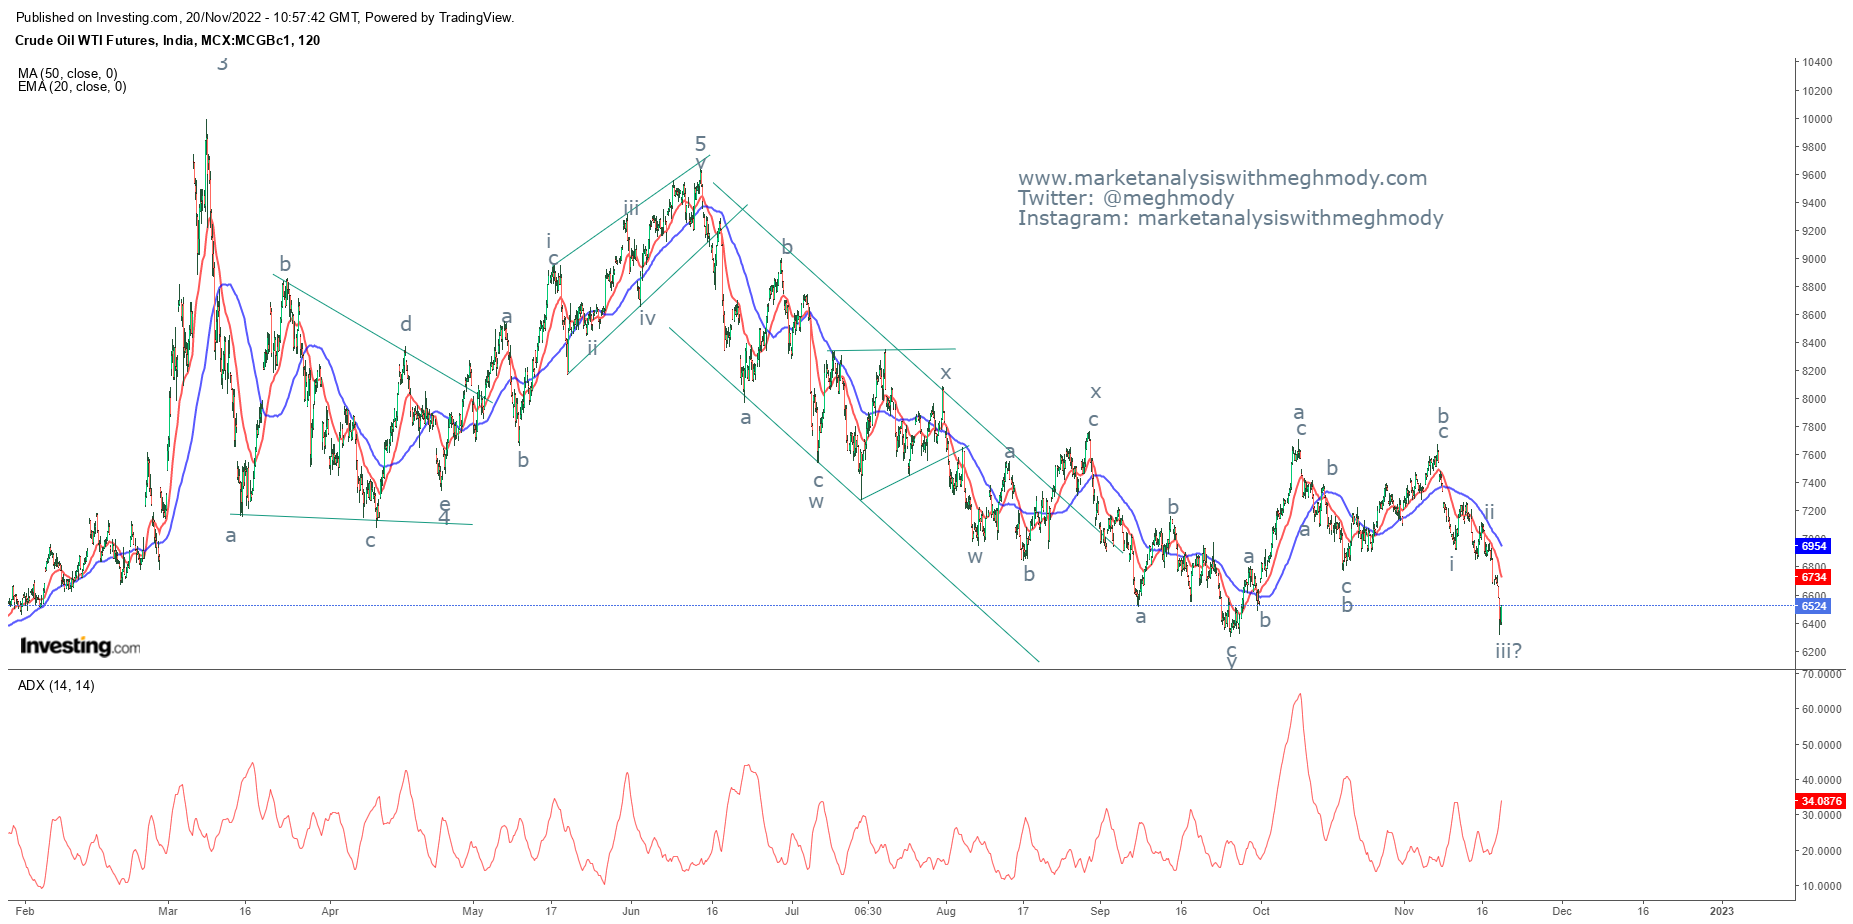
MCX Crude Oil 2 hour continuous chart
Analysis
From the above
chart, MCX Crude Oil has started moving in a lower highs and lower lows. Recently
the low of 6524 marked on 26th September 2022 was breached
indicating that Crude Oil is in stealth bear trend.
In the lower
panel, it is very clear that ADX has picked up momentum has is above 30 levels
suggesting that the downtrend is very strong.
As per wave
theory, prices have completed wave B in a flat pattern and has opened wave c lower
which can go till 5637 followed by 5082 which is 61.8% and 78.6% from wave a to
wave b.
The summation
is MCX Crude Oil is negatively poised and can move down towards 5637 levels
over short term followed by 5082 over medium term with resistance placed at
6954 (intraday basis).


Comments