Bank Nifty Elliott Wave Analysis
Bank Nifty daily chart
Analysis
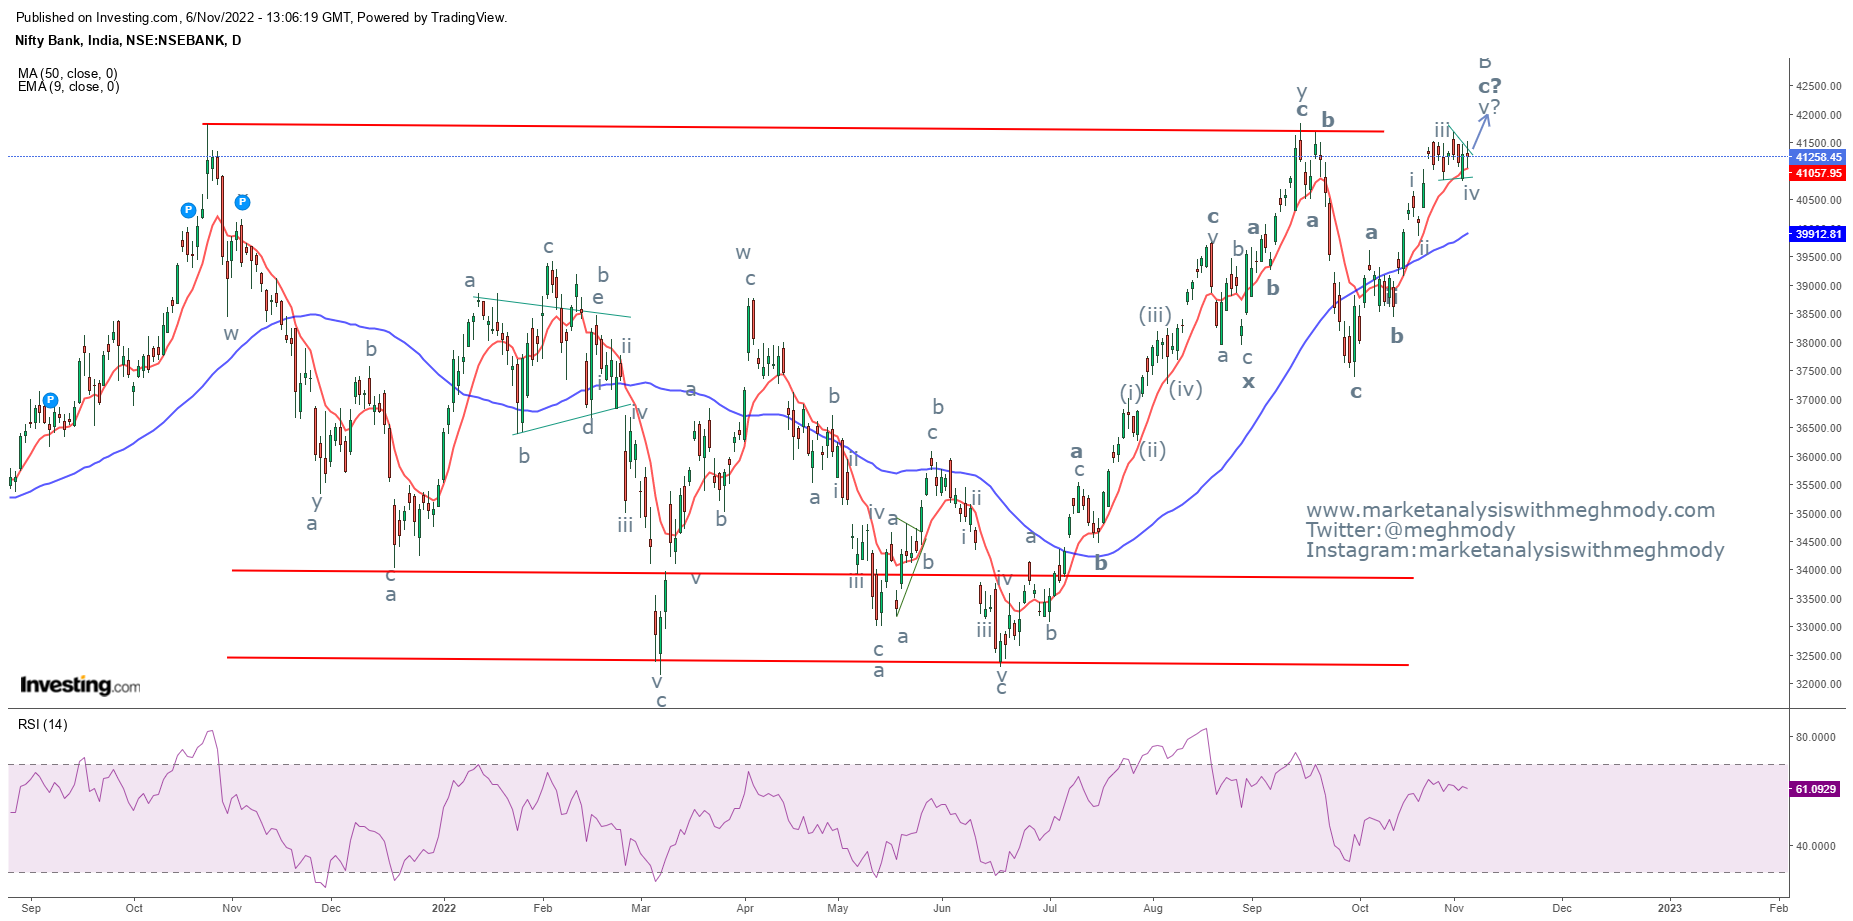
As shown in the above
daily chart, Nifty Bank continues to consolidate near the resistance zone (red
line) which is an indication that there is an overhead supply placed. However,
this resistance zone can be tested back again and the index can reach near to
this level as mentioned earlier. There is enough room for RSI to move higher as
it is well below the overbought terrain. Moving averages are favoring the index
more than Nifty earlier.
From 2 hour chart, Bank
Nifty continues to move in a sideways direction not moving below the support
level of 40670 which was mentioned in my earlier report. Currently it is moving
in a triangle pattern and once this pattern is over prices are then expected to
move in the positive direction. The recent sideways action has curbed the
volatility which made Bollinger Bands to contract, giving an indication that
there can be a breakout soon. RSI has taken the support of the center line.
As per Wave theory, as
of now prices are moving in wave c of the a-b-c pattern, in which it is moving
in a running triangle pattern, once the pattern is completed prices will start
wave v which is pending on the upside.
The summation is I
will likely stay with the same view for Nifty Bank as it can reach till
41800-42000 levels with support at 40670.


Comments