Nifty Anticipated Happened and forecast
Nifty hourly chart
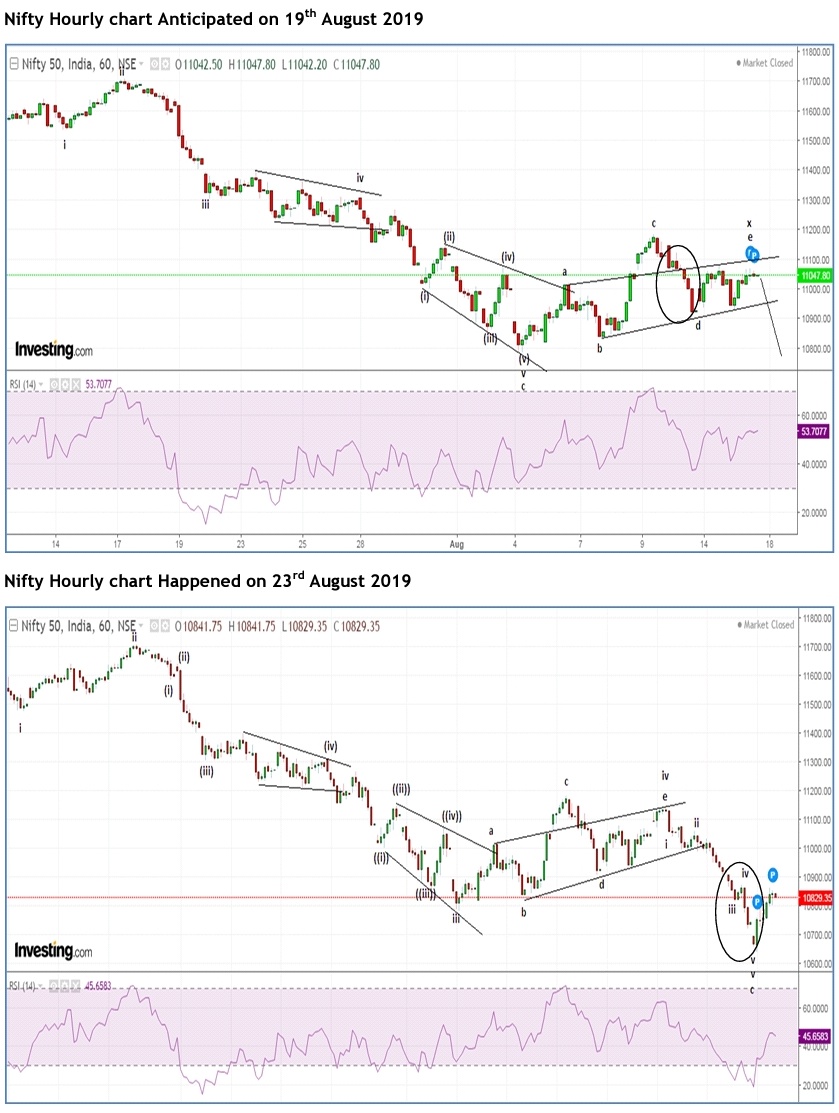
In my previous update dated 19th August 2019, I had mentioned that, “Nifty will continue to face resistance of 11180-11200.As far as this level is intact, the index is set to dip near till 10700-10650 levels, once 10900 is broken decisively.” – Anticipated Happened.
The index on Friday opened with a gap down and made a low of 10637 thus achieving my level of 10700-10650 levels. After making the intraday low prices shot up and closed above 10800 levels. In the above hourly chart, prices have shown signs of a bounce back but I will not say that a reversal has happened this is because there is no price confirmation. Prices are still trading in a falling black channel as seen in the daily chart. As far as prices persist in this channel the bias is still negative. Over short term it can bounce near till resistance of the channel which is placed at 10900-10930 levels. Any move above this level will give a bullish break in a falling channel pattern.
Wave theory suggests that, index have completed five waves down, this is an indication that a bounce back is likely. This bounce can take price close to 10900-10930 levels any move above this level will open the possibility of 11180-11200 levels. The recent up move will be wave a. I will monitor this move for some days for next minor leg to unfold.
The summation of the above three charts is, Nifty has bounced from multiple support of 10600. It has shown resilience from the channel support which can take prices higher till 10900-10930. Any move above this level will surge till 11180-11200 levels.


Comments