Posts

Gold Anticipated Happned

Image
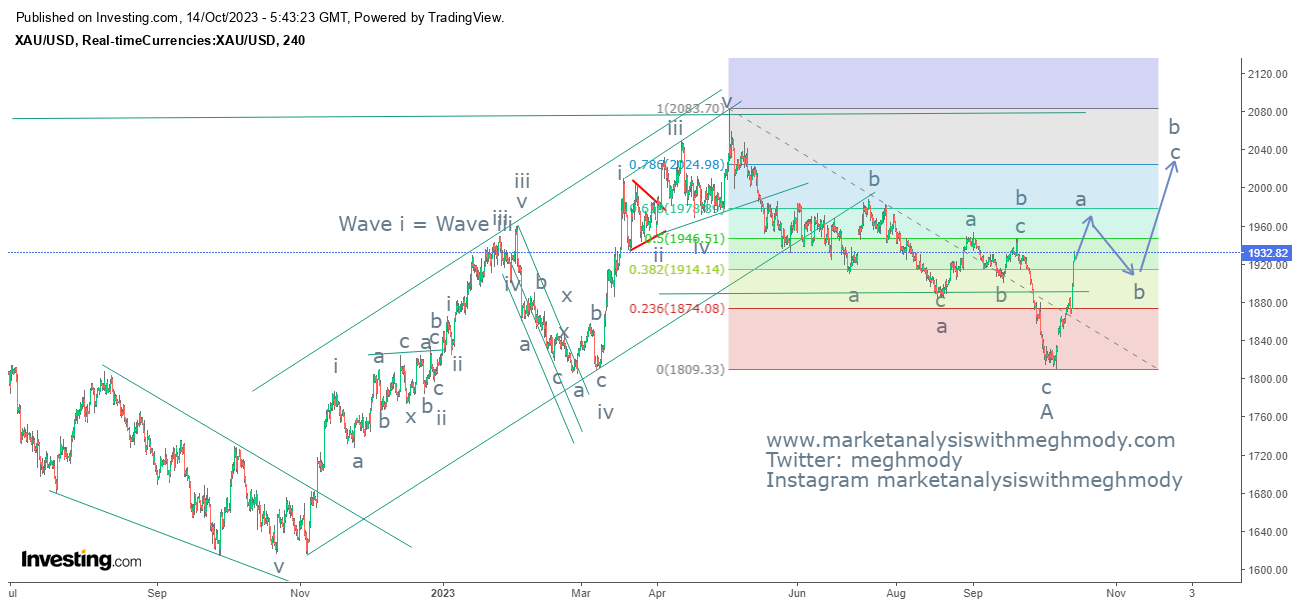
 Gold anticipated on 14th Oct 2023 Gold happened on 28th Nov 2023 Analysis In my prior article, I noted that "Gold prices have the potential to climb higher and may reach the $2025-2030 range in the short to medium term." The yellow metal indeed surged towards $2150 levels, surpassing my projected range of $2025-2030 when it was initially trading at $1933 - the anticipated outcome. To read my previous article on Gold, click on the link below https://www.marketanalysiswithmeghmody.com/2023/10/gold-and-elliott-wave-counts.html Presently, prices are following a flat pattern, having completed wave a of wave b, and this wave b is identified as a flat. The next movement could reach a minimum of 80%, translating to $2090 levels, or it might extend to $2150 levels or beyond. Clear-cut indications point towards prices fluctuating within the $2100-2150 range. Currently, prices are recorded at $2053 levels. To sum up, Gold prices display a positive outlook and are expected to fluctuate

MCX Copper change of trend underway?

Image
 MCX Copper anticipated on 21st Oct 2023 MCX Copper happened on 14th Dec 2023 Analysis In my earlier article, I expressed the view that MCX Copper prices would undergo a trend reversal after forming an accumulation pattern at the bottom. As anticipated, prices have indeed shifted direction and, notably, have successfully surpassed the resistance level. To read my previous article on MCX Copper, click on the below link https://www.marketanalysiswithmeghmody.com/2023/12/mcx-copper-change-of-trend-underway.html With a clear bullish breakout from a descending channel, it's evident that MCX Copper prices are poised for a positive trajectory in the foreseeable future. The red metal is expected to explore levels between 760 and 777, representing the 61.8% to 80% retracement of its previous decline. From a wave analysis perspective, the ongoing upward movement could be classified as wave c, following the completion of wave b in three legs (a-b-c). However, definitive evidence supporting it

Nikkei Anticipated Happened

Image
 Nikkei 225 Anticipated on 21st Oct 2023 Nikkei 225 Happened on 15th Nov 2023 Analysis In my prior article, I indicated that the Nikkei 225 showed a moderate positive outlook, suggesting a potential move to test 33000 levels as long as support at 30700 held. Despite a brief dip below 30700, the index swiftly rebounded, reaching my target of 33000—accurately predicted. To revisit the detailed analysis, you can access my previous article on Nikkei 225 through the following link: https://www.marketanalysiswithmeghmody.com/2023/10/nikkei-225-anticipated-happened.html . The chart illustrates a concerning lower high and lower low pattern, indicating a negative trend. In the recent week, the index closed near the resistance of a descending channel and encountered obstacles at the prior swing high of 33877 levels. Additionally, a bearish island reversal pattern has formed according to candlestick analysis. Examining the wave perspective, prices are currently in wave c, with wave i concluding a

MCX Crude Oil - Reversal as per Elliott Wave Analysis

Image
 MCX Crude Oil 4 hour chart Analysis According to the presented chart, the price movement of crude oil shows a consistent pattern of lower highs and lower lows, suggesting a prevailing negative bias. Notably, there was a recent breach of the previous low following the Crude Oil inventories report, leading to a decline towards the 5787 levels. Despite this, there is a potential for a relief rally or a reversal to occur at the current levels. Examining the Waves perspective, Crude Oil exhibited a three-leg pattern (A-B-C), with wave C concluding at 161.8% of the distance from wave A to wave B, as illustrated in the chart. Within wave C, there are distinct markings of five waves, hinting at the imminent completion of the downtrend. In summary, it is suggested that MX Crude Oil could experience a relief rally or a reversal in the vicinity of these levels, with the potential to test the 7000 levels in the future . Join my Telegram Channel :  https://t.me/elliottician1 Join My Twitter handle

MCX Copper Anticipated Happened

Image
 MCX Copper daily chart anticipated on 26th September 2023 MCX Copper daily chart happened on 5th October 2023 Analysis In my previous update on MCX Copper I had mentioned that red metal will dip towards 696 levels when it was trading at 713 levels. The base metal made a low below 696 on 5th October 2023 thereby achieving my levels - Anticipate Happened To read my previous article on MCX Copper, click on the below link https://www.marketanalysiswithmeghmody.com/2023/09/mcx-copper-neo-wave-neutral-triangle.html The base metal made a Neutral Triangle pattern and then it started plummeting the gains there by falling around 2.50% Currently it is in wave c and it looks like it is making an ending diagonal pattern (still not confirmed) The summation is MCX Copper can complete the ongoing leg and after that it can start moving higher. I will be monitoring the development in this asset class and will update accordingly. Join my Telegram Channel :  https://t.me/elliottician1 Join My Twitter han

Nikkei 225 Anticipated Happened

Image
 Nikkei 225 Anticipated on 26th Sep 2023 Nikkei 225 Anticipated Happened on 3rd Oct 2023 Analysis From my previous update on Nikkei 225 , I had mentioned that the index has formed a truncation and it is expected that it will falter towards 31250-31000 levels when it was at 32419 levels. The index plunged towards 30470 levels by opening with a huge gap down thereby achieving my mentioned level - Anticipated Happened To read my previous article on Nikkei 225, click on the below mentioned link https://www.marketanalysiswithmeghmody.com/2023/09/nikkei-225-truncation-and-elliott-wave.html As prices have dipped and made a low of 30470, from there on wards it has started moving higher in form of wave b where it can be a part of wave a of wave b which will be followed by wave b and wave c thereby completing wave b at one higher degree. In coming days Nikkei 225 will be trading in a broad range of 30700-33000 levels. The summation is Nikkei 225 is moderately positive from current levels as it c

GOLD and Elliott Wave Counts

Image
 Gold 4 hour chart Analysis As seen in the above chart, gold prices shot up after escalating geopolitical concerns. Gold prices are moving higher after making a low of $1800 levels and yesterday it closed well above $1930 levels and it is on the brink to cross its previous swing high, which will indicate that the trend is firmly positive. According to Wave theory, prices completed wave a at $1809 levels and has started moving higher in wave b which is also a corrective structure thereby forming a flat pattern, prices can move towards 80% (minimum) which comes to $2025-2030 levels and maximum it can go till 123.6%-138.2%. The summation is Gold prices can move higher going ahead and can test the level of $2025-2030 levels over short to medium term. Join my Telegram Channel :  https://t.me/elliottician1 Join My Twitter handle :  https://twitter.com/meghmody? s=11&t=LtKvFYlMyQs71k-udwEPgQ