Posts

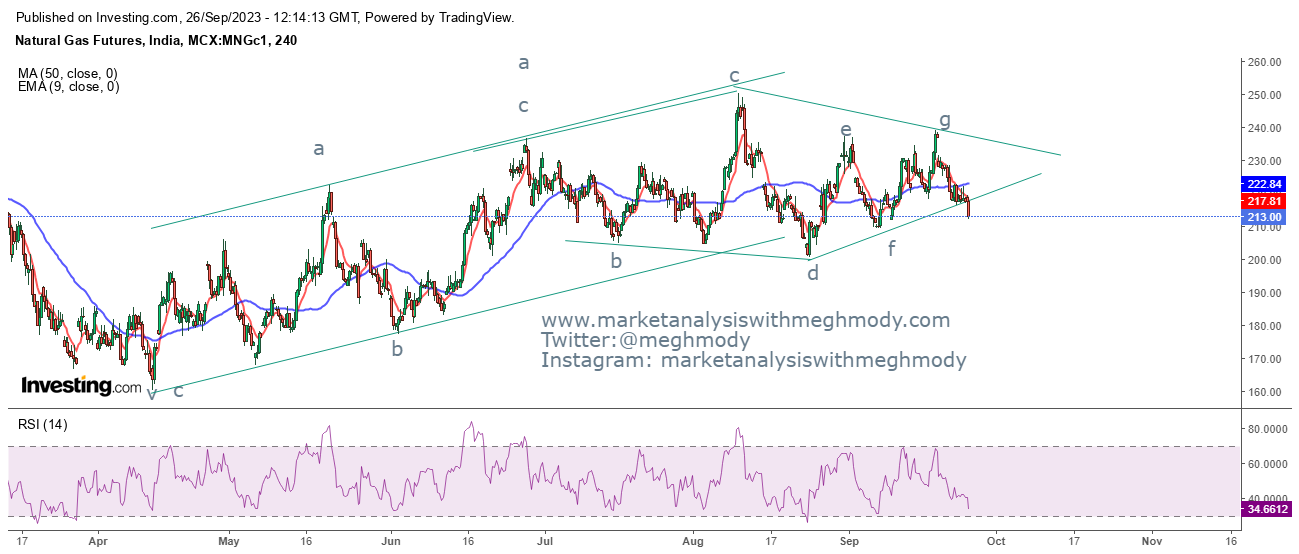
EURUSD in Triple Correction and Correlation with Gold

Image
 EURUSD daily chart Analysis As seen in the above daily chart, prices are making a high at 1.12 started tumbling down in a lower highs and lower lows fashion which is a negative setup. Just before US inflation data the pair was trading near to the resistance of the trend line and later it started shedding the gains as the pair was trading well above 1.0630 levels. From Waves perspective, prices are moving in triple correction (a-b-c-x-a-b-c-x-a-b-c) where in the first two correction is done and recently it also completed wave x at 1.0635 levels which has opened the third correction in the form of (a-b-c). However, if the pending correction does not happen and before that 1.0650 is taken out then it will not be the tripe correction as anticipated. It is also believed that there is a perfect positive correlation between Gold and EURUSD which seems to be decoupling as Gold has rallied the most post middle east conflict whereas EURUSD is under pressure due to Dollar strength. Below is the

MCX Natural Gas Neo Wave Diametric Pattern

Image
 MCX Natural Gas 4 hour chart Analysis From the above chart, prices are moving in a diamond shape pattern which recently got completed as it broken the lower trend line of the pattern. Prices are currently trading at 213 levels and the target based on the pattern comes to 182 levels.  As per wave theory, prices have completed Neo wave diametric pattern which can be a continuous pattern or a reversal pattern. In the above case it is a reversal pattern. There are high chances that prices will falter towards 195 levels where cluster of supports are placed. The summation is MCX Natural Gas is firmly negative as it can falter towards 195 levels over short term. Join my Telegram Channel :  https://t.me/elliottician1 Join My Twitter handle :  https://twitter.com/meghmody? s=11&t=LtKvFYlMyQs71k-udwEPgQ

Nikkei 225 Truncation and Elliott Wave forecasting

Image
 Nikkei 225 daily chart Analysis From the above chart, Nikkei 225 has completed five waves up in which third wave was the biggest wave and that is the reason fifth wave was a truncation or a fifth failure. Now since five waves are completed chances are much higher that correction will follow which can drag prices below its previous sing ow placed at 31250 levels. The summation is Nikkei 225 is firmly negative and can sink towards 31250-31000 price range over short term. Join my Telegram Channel :  https://t.me/elliottician1 Join My Twitter handle :  https://twitter.com/meghmody? s=11&t=LtKvFYlMyQs71k-udwEPgQ

MCX Copper Neo Wave Neutral Triangle

Image
 MCX Copper Daily Chart Analysis As seen in the above chart, prices corrected from the top of 794 levels and made a swing low at 696 levels, thereafter it moved higher with slow momentum but could not cross its previous high of 794 levels as it topped out at 757. This concludes that the lower high is formed. From Waves perspective, the first fall was corrective in nature (a-b-c) which completes wave a at one higher degree. The counter correction is a part of Neo Wave Neutral triangle where five legs are marked (a-b-c-d-e) this completes wave b at one higher degree and now wave c is in motion which is impulsive in nature and can move back down towards 696 levels. The summation is MCX Copper is negatively poised and can move down towards 696 levels over short term. Join my Telegram Channel :  https://t.me/elliottician1 Join My Twitter handle :  https://twitter.com/meghmody? s=11&t=LtKvFYlMyQs71k-udwEPgQ

MCX Gold and Flat pattern

Image
 MCX Gold daily chart Analysis MCX Gold has shown good bounce from the lower levels of sub 58000 and from there it has shown signs of reversal. The yellow metal is in stealth up trend as none of the previous lows are taken out there by indicating that the trend is firmly positive. As per Wave theory, prices are moving in wave iv after extended wave iii. Wave iv is likely to kill time where in it has completed wave a near to 58000 levels and has already opened wave b of wave iv which can go till 80% (minimum) and 123.6% -138.2% (maximum) possibility. As of now I think it can go till 61500 levels to 61800 levels which is 80% retracement of the previous fall. The summation is MCX Gold is positively poised from current levels, it is expected to move near to 61500-61800 levels over short to medium term. Join my Telegram Channel :  https://t.me/elliottician1 Join My Twitter handle :  https://twitter.com/meghmody? s=11&t=LtKvFYlMyQs71k-udwEPgQ

MCX Crude Oil Head and Shoulders and Elliott Wave Forecasting

Image
 MCX Crude Oil 2 hour chart In my previous update I had mentioned that Crude Oil can move towards 7000 levels and from there it can open deeper retracement possibility.  The commodity has started moving down in corrective wave and can stumble further as expected. To read my previous article, click on the below mentioned link https://www.marketanalysiswithmeghmody.com/2023/08/mcx-crude-oil-anticipated-happened.html Currently prices are moving down in a double correction (a-b-c-x-a-b-c) where it is in the process to complete wave x near to 6700 levels and from there it will open second corrective wave which will start from wave a by breaking its previous low. The first correction was a zigzag and second can be a zigzag or flat which will then change the correction name mentioned above. The commodity has also formed bearish head and shoulder pattern and the target of the pattern comes to 6100 levels which is also 61.8% of 5524-7026 levels. The summation is MCX Crude Oil is expected to tum

MCX Natural Gas and Elliott Wave Analysis

Image
 MCX Natural Gas daily chart Analysis From the above chart, prices are moving in a sideways pattern, where prices are moving in a stiff range of 200 on the lower side and 230 on the higher side. As far as prices persist in this range the bias remains sideways. The broad range could be 170 on the lower side and 250 on the higher side. In the stiff range, any move above 230 can take prices near to 250 levels. A deeper correction cannot be rule out either. As per Wave theory, prices are moving in a sideways trend and can open double correction (a-b-c-x-a-b-c-) or a flat (a-b-c) The summation is MCX Nat Gas is expected to remain in a broad range of 170-250 levels. However, from current juncture, there can be an attempt towards 230-250 price range. Join my Telegram Channel :  https://t.me/elliottician1 Join My Twitter handle :  https://twitter.com/meghmody? s=11&t=LtKvFYlMyQs71k-udwEPgQ