Posts

MCX NAT GAS Anticipated Happened

Image
 MCX Nat Gas daily continuous chart anticipated on 6th June  2021 MCX Nat Gas daily continuous chart happened on 26th July 2021 In my previous article on Nat Gas, I had mentioned that, " P rices can test 200 levels over short term which can drag prices lower, buying opportunity can be expected at these levels which can soar prices towards  300 to 315 levels over medium term." I initially thought that prices are moving in a triangle pattern and so wave e of the triangle can test 200 levels which I was wrong in the short term. However, I was correct in anticipating the medium term as it can test 300-315 levels which is achieved- Anticipated Happened Here is the link of my previous article on NAT GAS https://www.marketanalysiswithmeghmody.com/2021/06/mcx-nat-gas-reversal-pattern-and.html Prices have completed wave b in a flat pattern and following that an impulse structure can be seen which is undoubtedly wave c. Now a correction either in the form of wave x or a deeper correcti

EURINR Neo Wave Diametric Pattern Anticipated Happened

Image
 EURINR daily continuous chart anticipated on 5th July 2021 EURINR daily continuous chart happened on 19th July 2021 In my previous update dated 5th July 2021, I had mentioned that, "  EURINR is hovering near resistance and can sink near to 87.6-87.5 levels over short term." EURINR made a low of 87.33 on 19th July 2021, thereby achieving my mentioned level of 87.6-87.5 levels- Anticipated Happened The chart shown on 5th July or 19th July or when the article is written depicts Neo Wave diametric pattern, a seven leg pattern which has lot of variations. You can see the previous article of EURINR by clicking on the link https://www.marketanalysiswithmeghmody.com/2021/07/eurinr-neo-wave-diametric-pattern.html After completing diametric pattern there are high chances for the pair to bounce or can change the trend from negative to positive. This can be the end of wave ii or wave a of wave ii, once completed wave iii on the upside will start.

ICICI Bank Elliott Wave Analysis Anticipated Happened

Image
 ICICI Bank daily chart anticipated on 4th July 2021 ICICI Bank daily chart happened on 26th July 2021 In my previous update on ICICI Bank I had mentioned that, " ICICI Bank is firmly positive and can move higher from current levels close to 680-685 levels as far as 615 is intact on the downside." The banking stock move up and achieved the level of 680-685 levels by forming an expanding diagonal pattern - Anticipated Happened As per Elliott Wave, prices which were expected to move up in the form of wave c, has converted into expanding diagonal pattern, once completed there wil be a correction either in the form of wave x or bigger correction.

MCX Copper Inverse Cup and Handle Pattern and Elliott Wave Analysis Anticipated Happened

Image
 MCX Copper hourly continuous chart anticipated on 6th July 2021 MCX Copper hourly continuous chart happened on 26th July 2021 In my previous update I had mentioned for MCX Copper, "  MCX Copper can achieve levels of 760-765 over short to medium term with support at 712." The red metal moved sideways and marked a low of 711.4 but did not closed below 712 and continued to move higher thereby achieving my level of 760-765 levels - Anticipated happened. MCX Copper has rallied over 30-35 INR from July 6, thereby gaining 4.80% . The bias over medium term will continue to be positive and can move up from here as well. Here is the link of my previous article on MCX Copper, this will show how I had predicted the rise, click on the link https://www.marketanalysiswithmeghmody.com/2021/07/mcx-copper-inverse-cup-and-handle-and.html Now If I am correct in anticipating the rise and the wave counts I had placed then MCX Copper is least likely to fall back till 725 levels. If it does then we

Correlation amongst asset classes Part 2

Image
Correlation - Positive or Negative is more effective if you see it on the chart, for that it is imperative that you compare two asset classes of your like. I have come up with some charts where I have two different asset classes moving either in sync or inverse with each other. MCX Crude and Nifty- Positive Correlation In the above chart, the blue line is the Nifty Index and the purple line is MCX Crude Oil placed on a weekly chart. This is how MCX Crude Oil bounced after going negative and Nifty bounced after hitting the pandemic low last year. Gold and DXY- Negative Correlation As shown in the above chart, Gold is shown in the blue line and DXY in the purple, both are moving against each other giving an indication that both are inversely related. US Interest Rates and S&P500 - Negative Correlation Historically, Equities have been moving up after the end of subprime crisis, this is because the interest rates were dragged down by the FED just before the crisis. As and when the inte

Correlation amongst asset classes Part 1

What is a correlation? Inter market analysis is a method of analyzing markets by examining the correlations between different asset classes. How may types of Correlation? There are two types of Correlation, Positive and Negative. Which is the Best Correlation? Negative Correlation. Why Negative Correlation is the best? It can help to minimize loss. For eg. There is a negative correlation in Gold and Equities, so one can invest in both the asset class to diversify the portfolio, so when there is a unprecedented event like war or Covid-19 Gold will act as a safe haven and equities can become volatile.  How to check the Correlation? The best way to understand the Correlation is to see on the charts and figure it out.  What is a Positive Correlation? A Positive Correlation is when both the asset class moves in sync with each other or can even be in tandem. What is a Negative Correlation? A Negative correlation is when two asset class show divergence or move away from each other.

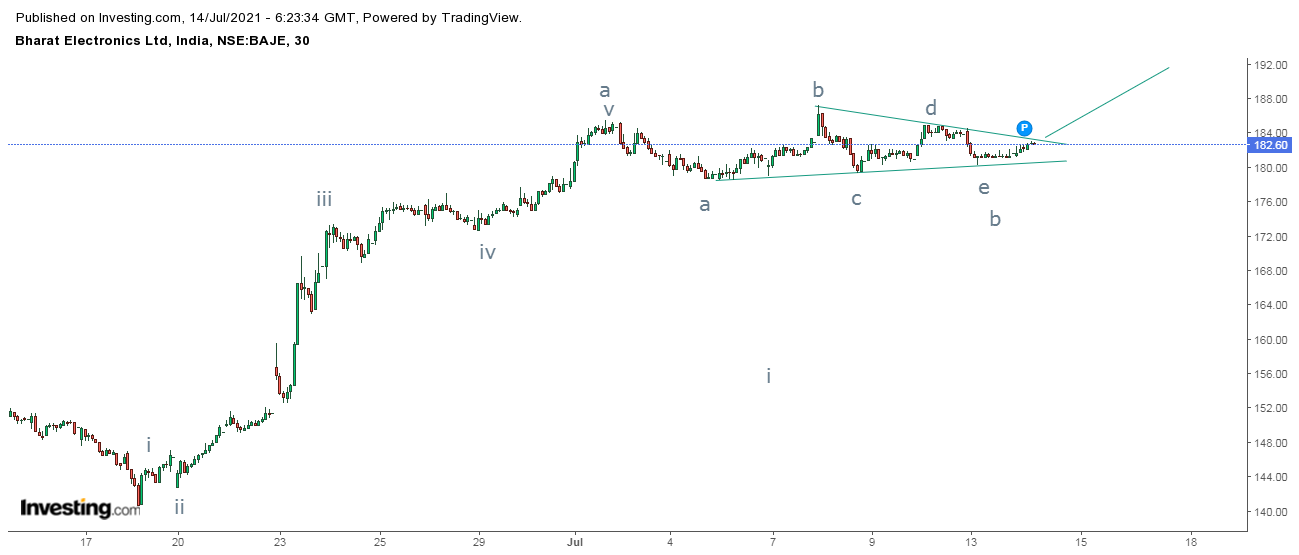
BEL re-visited

Image
 BEL half hourly chart anticipated on 14th July 2021 BEL half hourly happened on 19th July 2021 In my previous update about BEL, I had mentioned that, "P rices are set to surge till 190-192 levels over short term as far as the level of 179 is intact on the downside." The stock surged till 188 levels close to my target level. To view the previous article on BEL click on the below mentioned link https://www.marketanalysiswithmeghmody.com/2021/07/bel-elliott-wave-analysis-running.html I thought that it is a symmetrical triangle pattern which eventually turned into a complex correction. One thing is for sure that wave c cannot terminate at this level and so I am still open, there is also another possibility for prices to still move in wave b and so wave c has still not started. Wave b can be as complex as possible. I will monitor the movement going forward and will update timely onto this.