Gold in a complex correction pattern.
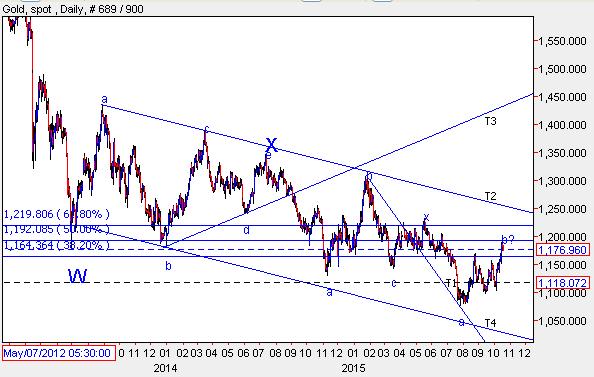
From the top of $1920 marked on 5th September 2011 prices failed to sustain at higher levels, eventually resulting in a crash. Currently it is trading at its three month high from the bottom of $1076 at $1176 per ounce, but it seems that this rally will fail going ahead. Technically speaking, gold is moving in a negative direction forming a lower high and lower trough. Prices are also moving precisely in a downward sloping channel. The recent bounce have already retraced 50% of the previous fall, it can also retrace 61.8% placed at 1219 levels which is closer to the resistance of the channel . However, the momentum will fail to support prices which will mark a reversal. As per wave theory, prices are moving in a complex correction (W-X-Y) within which Wave W was a three wave pattern, wave X was a triangle and wave Y which is ongoing seems to be a double correction (a-b-c-x-a-b-c). Currently it is moving in wave c of wave b of the second correction in which it has completed t