Posts

Nikkei 225 Anticipated Happened

Image
 Nikkei 225 daily chart Analysis From the above chart, as expected prices completed the diamond pattern and has started moving higher. I had predicted this rise in the month of January 9th and covered it in the report as well. You can view the excerpt from the report by clicking on the link https://www. marketanalysiswithmeghmody. com/2023/01/nikkei-neo-wave- diametric-revisited.html As per wave theory, prices completed Neo wave diametric pattern and has started fresh leg on the upside which is impulse in nature but on higher degree it will be a zigzag where it will complete wave a followed by wave b and then wave c higher. In ongoing wave a, there are five legs where wave 5 is in motion which can go above 28000 in near term. The summation is Nikkei 225 is set to move higher as expected and can move above 28000 levels over short term.
GBPINR: Symmetrical Triangle in making

Image
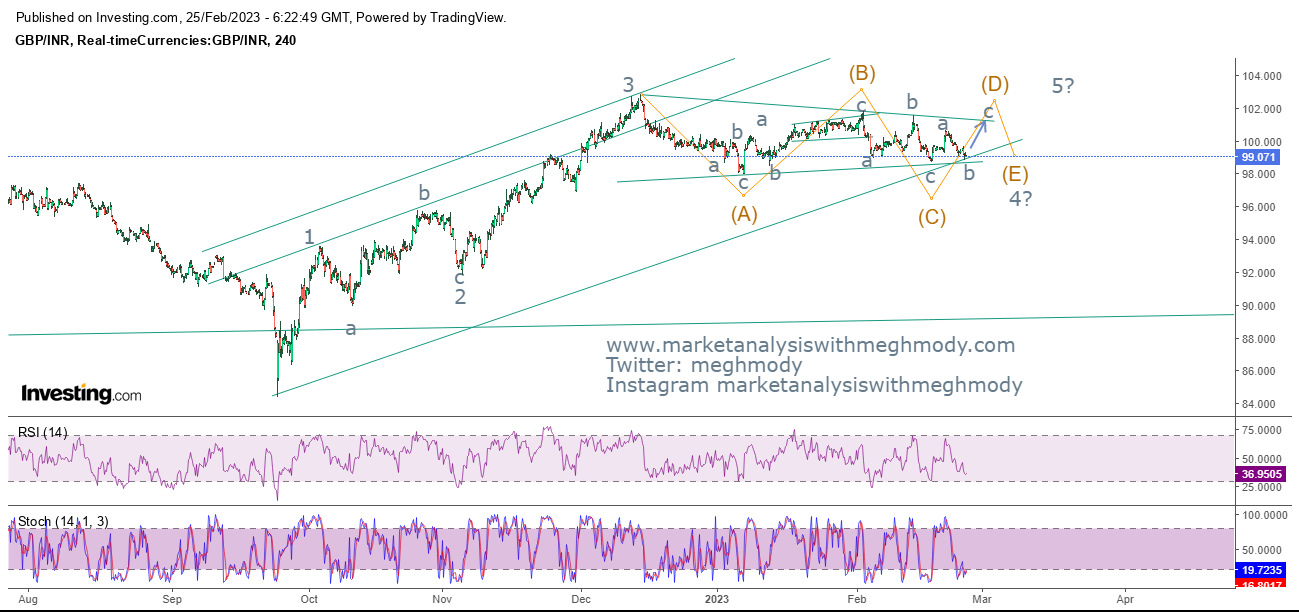
 GBPINR 4hour chart (spot) Analysis As seen in the above chart, prices are moving in a stiff range of 102-98 levels and as when time moves on the range becomes narrower thereby opening the possibility of a triangle pattern (symmetrical). For prices to give a breakout, it is important that it happens before 40% from the apex of the triangle. In the above case there is ample of time for that. Currently prices are near to the lower range of the triangle pattern and can move higher from current levels to test 101-101.50 levels over short term. RSI and Stochastic both are near to the oversold terrain and it seems that there is a high possibility for prices to move higher from current levels.  From Waves perspective, the pair is moving in wave 4 in which it is making a symmetrical triangle pattern (a-b-c-d-e) where it is currently moving in wave d where wave c is pending on the upside. Once wave d is over wave e on the lower side will start. The summation is GBPINR is set to move higher towa

Bank Nifty Update

Image
 Bank Nifty daily chart Bank Nifty 2 hour chart Analysis As shown in the above daily chart, prices continue to face the resistance of 41600 levels where it was first taking support. At present, just like Nifty it is forming a rising wedge pattern which once complete will open negative possibilities. Please understand prices are in a downtrend as the rising channel pattern is broken thereby opening negative possibilities. ADX is also not picking up indicating that the recent upmove is weak. From 120 mins chart, prices are moving in a very narrow range. So I have applied Bollinger Bands which also shows that it is narrowing and there is a high possibility for the breakout to emerge, which is above or below the bands. MACD is trend less as there is no clear signal maintained by the oscillator. As per Elliott Wave theory, prices are moving in wave ii of wave c where wave c is still in making. It looks  to be ending diagonal pattern in wave c and once it is complete and prices break below 4

Nifty Update

Image
 Nifty daily chart Nifty 2 hour chart Analysis As seen in the above daily chart, prices continues to be moving in a stiff range of 17700-17900 and consolidating near to the resistance of the falling trend line. There are also multiple of resistances placed at these levels where 20 EMA (red) and 50 SMA (blue) is placed. I will continue to hold my downside levels as mentioned in my previous update with resistances placed at 18100 levels. RSI has also relieved from the oversold terrain giving room to the downside levels. To read my previous article on Nifty, click on the below mentioned link https://www.marketanalysiswithmeghmody.com/2023/02/nifty-elliott-wave-analysis.html From 2 hourly chart, the index seems to be forming a rising wedge pattern (marked in red lines). Rising wedge has the potential to give a downside breakout but it seems that there is still a minor upmove left for the index. RSI is going up without a positive divergence. As per Wave theory, Nifty is moving down in an im

Bitcoin Elliott Wave Analysis

Image
 Bitcoin 240 mins chart Analysis From the above chart, prices could not move above $24000 which lead the price to tumble below $22000. It is very clear that the crypto is falling in a counter move, this means that it will face a Fibonacci number for the support. As per Wave theory, prices are moving in wave ii and can take support near to wave iv of wave i where the lower horizontal line is placed. In short, prices are likely to remain or consolidate in a range of $24000-$20000 for some time which will complete wave ii and eventually wave iii on the higher side will unfold. The summation is BTC will continue to remain in a range of $24000-$20000 for some time after that prices will pickup momentum and reach towards $33300-$33400 price range (minimum).  

Ethereum Anticipated Happened

Image
 Ethereum 240 mins chart anticipated on 4th Feb 2023 Ethereum 240 mins chart happened on 10th Feb 2023 Analysis Last week I had mentioned for ETH that, "  if Ethereum falters towards $1500 it can be utilized as a buying opportunity. Any move above $1680 will continue to uptrend" ETH was meant to buy at $1500 or near to it was because wave ii was unfolding, I had captured successfully the entire fall from $1640 levels - Anticipated Happened. To read my previous article on ETH, click on the below mentioned link https://www.marketanalysiswithmeghmody.com/2023/02/ethereum-wave-2-opening.html As seen from the above chart, prices failed to move above the red horizontal line and as a result it tumbled and arrived near to its previous low. It will be important to see if there is a sharp reversal coming for this crypto, if so then an intermediate bottom is at place and then there are high chances for prices to transcend its previous high and make a new one. As per wave theory, prices

Hang Seng - Elliott Wave Analysis

Image
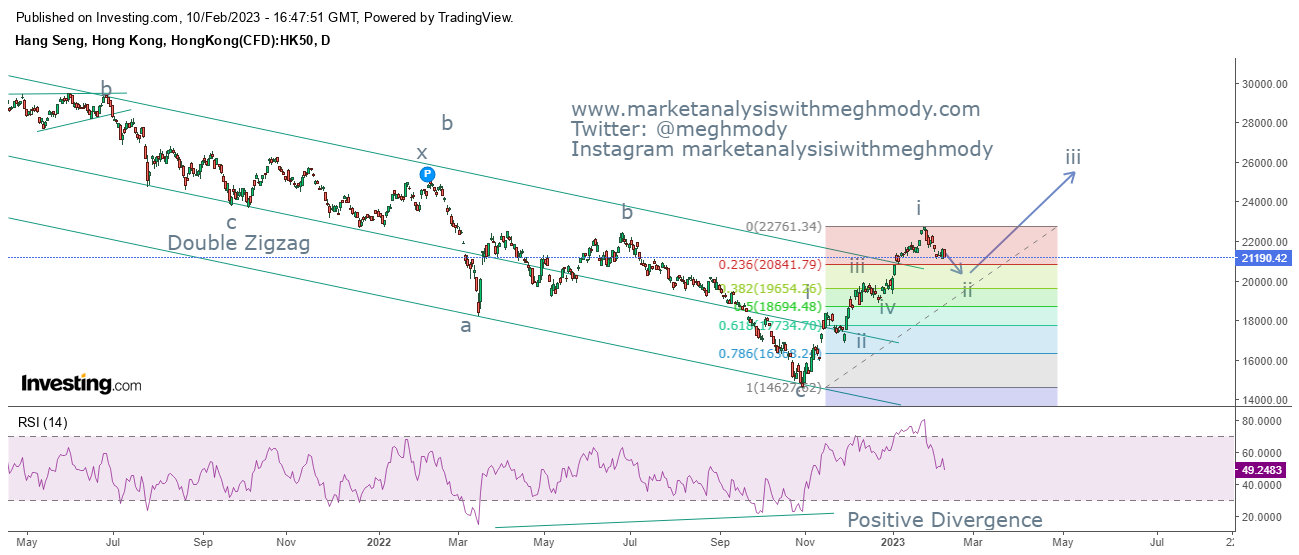
 Hang Seng daily chart Analysis As shown in the above chart, prices which were moving in a falling channel has closed above it thereby giving bullish break. Along with that, the index was sustaining well above it. Hang Seng after making a high of 22760, has started falling and arrived near to the support of the falling channel (earlier resistance). RSI has also turned negative. From Waves perspective, the index is moving in wave ii and it seems that wave i is extended, this means that wave ii is unlikely to go below 38.2% from the bottom till 22760 levels. Again this is a guideline and not a rule. The level of support comes to 19600 levels (38.2%). The summation is Hang Seng is unlikely to go below 19600 and can consolidate in the range of 22760-19600 levels over the time.