Posts

GBPINR: Triple Correction ongoing

Image
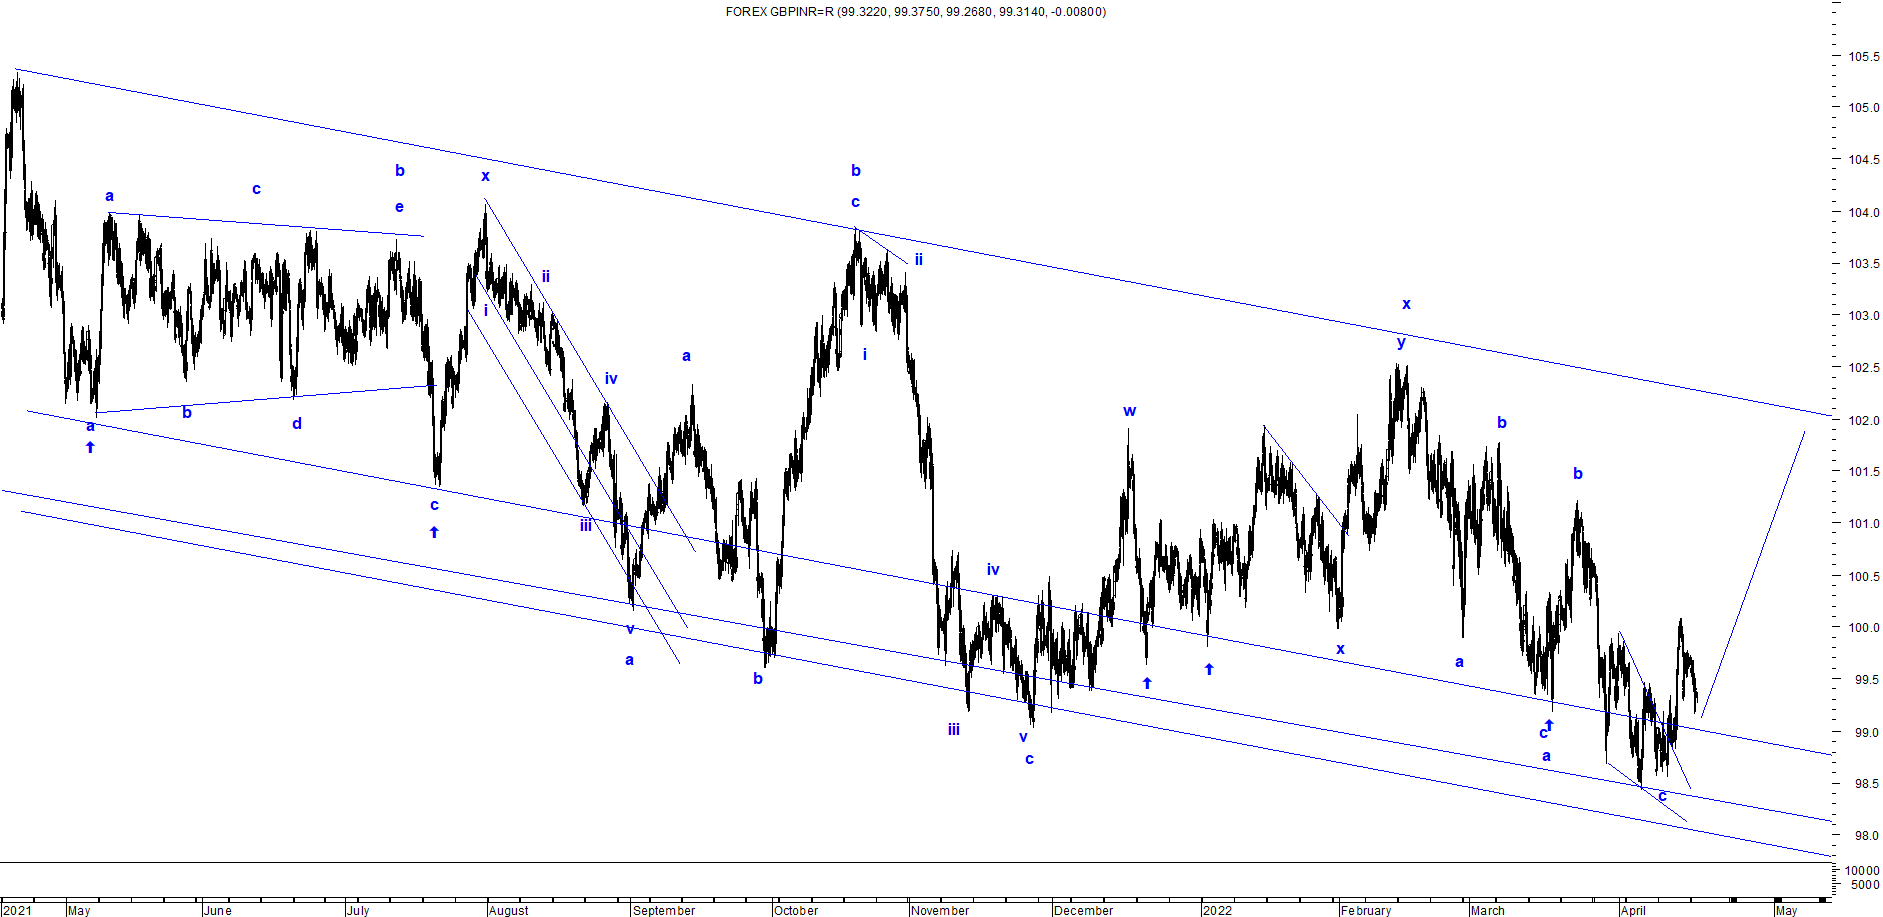
 GBPINR spot hourly chart In my previous update I had mentioned for GBPINR that, " GBPINR can test 99 levels but will reverse the direction to move back up till 102 levels over medium term." To view my previous article on GBPINR, click on the below link https://www.marketanalysiswithmeghmody.com/2022/03/gbpinr-anticipated-happened.html Prices plunged to 98.5 there by achieving my downside target of 99 but it is now on the brink to reverse as it can test the resistance of the falling channel- Anticipated happened As per Wave analysis, prices are moving in a Triple correction (a-b-c-x-a-b-c-x-a-b-c) where it has completed wave a of the third correction and it is all set to start wave b on the higher side which can move back up till 101.7-102 levels. The summation is GBPINR is set to bounce from the support of the channel and can test 101.7-102 levels over short period of time.

MCX Natural Gas: Elliott Impulse Wave

Image
 MCX Natural Gas daily chart As shown in the above chart, prices are moving up strongly despite of  RSI in overbought terrain, normally in this situation prices are drive by heavy demand and it is likely that it will stay higher over the course of time. From Waves perspective, NG is moving in wave 5 of an impulse which is likely to be extended and can move higher towards its next resistance of 630-650 levels where 261.8% of wave 1 to wave 4 is placed. The summation is MCX Natural Gas is bound to surge till 630-650 levels over short term.

MCX Crude Oil: Elliott Wave 5th Wave

Image
 MCX Crude Oil daily chart MCX Crude Oil is all set to rise again and can also move above its previous high as higher highs and higher lowers are intact. Secondly the shift in the angle has changed which can be verifies as it has broken the rising channel on the higher side. RSI has also relieved from the over bought terrain which is a positive sign. As per Wave Theory, prices have completed wave 4 in simple zigzag and it has started moving higher in the form of wave 5 of an impulse. Wave 1 was extended, wave 2 has not even moved below 38.2% of wave 1. Wave 3 is not 100% of wave 1 which opens the possibility that wave 3 will be shorter than wave 3. In this case, 5th wave can move up till 10000 -10200 levels over short term. The summation is MCX Crude Oil is positively poised and can move till 10,000-10,200 levels over short term

MCX Crude Oil: Revisited

Image
MCX Crude Oil 60 mins chart anticipated on 13th April 2022 MCX Crude Oil 60 mins chart happened on 14th April 2022 In my previous update on MCX Crude Oil I had mentioned that, " MCX Crude Oil is set to soar near till 7950-8000 levels over short term."  Prices after giving a bullish break continued to soar and achieved my mentioned level of 7950-8000 levels on following day - Anticipated Happened I had following the MCX Crude Oil chart and applied Elliott Wave on it and was highly successful in anticipating the fall along with the rise. To view my articles on MCX Crude Oil, click on the below link MCX Crude Oil Anticipated Happened https://www.marketanalysiswithmeghmody.com/2022/04/mcx-crude-anticipated-happened.html MCX Crude Oil: Simple Zigzag pattern https://www.marketanalysiswithmeghmody.com/2022/04/mcx-crude-oil-simple-zigzag-elliott.html As now the trend for the black gold is firmly positive, I will continue to monitor the prices of crude oil to understand if it is impul

MCX Crude: Anticipated Happened

Image
 MCX Crude Oil 60 mins chart anticipated on 1st April 2022 MCX Crude Oil 60 mins chart happened on 11th April 2022 In my previous update on MCX Crude Oil, I had mentioned that, " MCX Crude Oil can test the level of 7155 followed by 6620 levels over short term." I had given two targets in MCX Crude where the first one was achieved as it made a low of 7071 which was 61.8% of wave a to wave b. The second target was 161.8% of wave a to wave b where zigzags can be completed which it did not - Anticipated Happened To view my previous article on MCX Crude Oil, you can click on the below link https://www.marketanalysiswithmeghmody.com/2022/04/mcx-crude-oil-simple-zigzag-elliott.html Prices plunged by over 7.30% in 7 trading sessions and then bounced from cluster of supports breaking the falling trend line resistance and also the falling wedge pattern, both indicates that downtrend is over. As per wave theory, prices have completed wave a wave b and wave c in an ending diagonal patter

Tata Steel: Elliott Wave Analysis

Image
 Tata Steel 60 mins chart As shown in the above chart, prices are moving in a lower highs and lower lows and it is moving precisely in the falling channel. At current juncture, the stock is hovering near to the resistance of the falling channel and has also formed a rising wedge pattern.  From Waves perspective, prices have completed wave b and has unfolded wave c lower. In wave b, wave c of wave b is ending diagonal which was broken on 11th April 2022. As of now it is moving back up to test the resistance of the pattern. This concludes than wave c has started and can move down to test 1070 levels where cluster of supports are placed. The summation is Tata Steel is negatively poised and can plunge near till 1070 levels over short term.

Bank Nifty: Anticipated Happened and a reversal on cards?

Image
 Nifty Bank 60 mins chart anticipated on 2nd April 2022 Nifty Bank 60 mins chart happened on 3rd April 2022 In my previous update I had mentioned that, " Nifty Bank will continue to move higher close to 37500-37650 levels over very short term." To view my previous article on Nifty Bank click on the below link https://www.marketanalysiswithmeghmody.com/2022/04/bank-nifty-anticipated-happened-and.html The index crossed my level and also moved above the trend line resistance but failed to sustain above it, thus re-entering the falling channel. This opens negative possibilities for the the index. At present it is holding the trend line support, break of this level will infuse selling pressure and can drag prices way to lower. From waves perspective, prices have completed wave x  and will start double correction in this index (a-b-c-x-a-b-c). After completion of wave x, the index has started wave a which can move close to wave c of first correction. I am not in a rush to give bigg