Posts

Nifty: Anticipated Happened and road ahead with Elliott Wave

Image
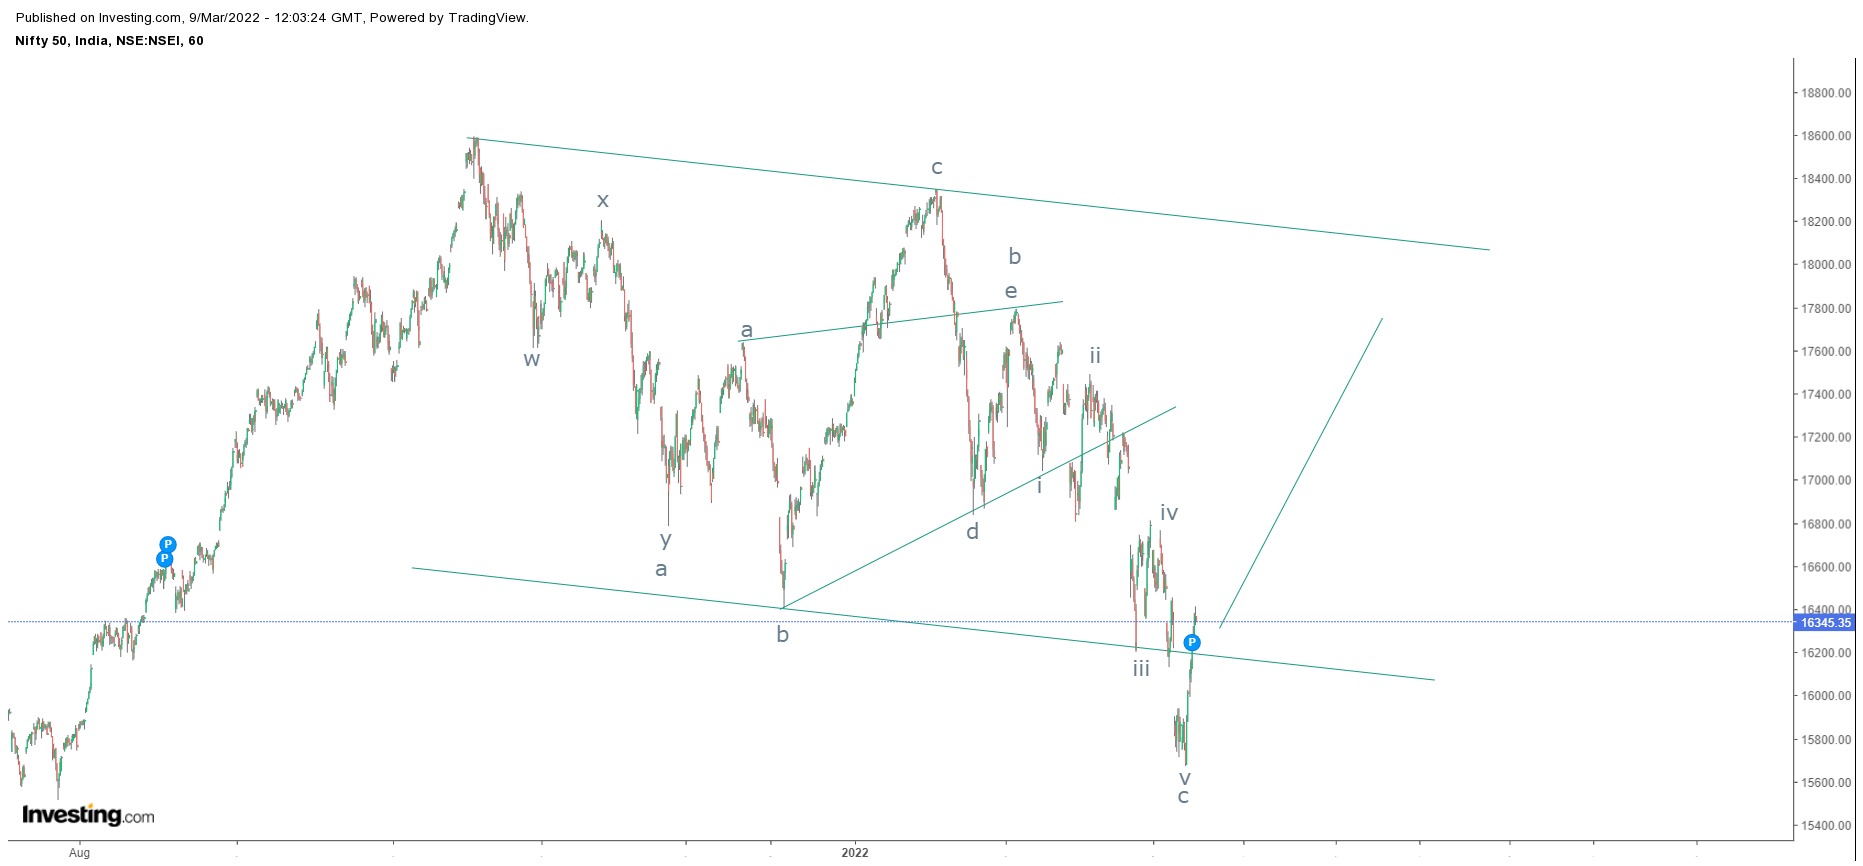
 Nifty 60 mins chart anticipated on 9th March 2022 Nifty 60 mins chart happened on 4th April 2022 In my previous update I had mentioned that, "  I will continue to be positive for Nifty and it can move higher till 17600-17800 levels over short term." Nifty closed well above 18000 mark which has achieved my level of 17600-17800 levels - Anticipated Happened To view my previous article on Nifty, click on the below link https://www.marketanalysiswithmeghmody.com/2022/03/nifty-neo-wave-neutral-triangle-and.html Nifty has arrived near cluster of resistance marked by arrows also it is moving precisely in the rising channel which is steeper. This entire up move looks to be corrective but I am also opening  impulse wave as well, only a move above 18160 will open further positive possibilities. However, I still think that it will reverse from current levels and complete wave x. The summation is Nifty is set to reverse only a move below 17700 is broken which will infuse selling pressur

Bank Nifty: Anticipated Happened and Elliott Wave Analysis

Image
 Bank Nifty hourly chart anticipated on 9th March 2022 Bank Nifty hourly chart happened on 1st April 2022 In my previous update on Bank Nifty, I had mentioned, " Nifty Bank is positively poised and can move higher from current levels towards 37000-37300 over short term." On 1st April Nifty Bank made a high close to 37200 levels thereby achieving my above mentioned range/level - Anticipated Happened To view my previous article on Bank Nifty, click on the link below https://www.marketanalysiswithmeghmody.com/2022/03/bank-nifty-neo-wave-extracting-triangle.html The index after giving a bullish break in a small falling channel, it started moving higher in a higher highs and higher lows and also arriving near to crucial resistance of the big falling channel. I think prices can move tad higher from here to test the resistance zone. As per Wave theory, prices are moving in wave x, there is a high possibility prices will move close to 37500-37650 levels over very short term which wil

Nifty Metal Index: Anticipated Happened and Elliott Wave Forecasting

Image
 Nifty Metal Index daily chart anticipated on 20th March 2022 Nifty Metal Index daily chart happened on 29th March 2022 In my previous update I had mentioned for Nifty Metal Index that, " Nifty Metal Index is positively poised and can move towards 6570-6750 levels over short term." The index moved well above my first resistance of 6570 and made a high of 6620 levels thereby achieving my mentioned level - Anticipated Happened To view my previous update on Nifty Metal Index, click on the below mentioned link https://www.marketanalysiswithmeghmody.com/2022/03/nifty-metal-index-elliott-wave-anlysis.html As per Elliott Wave Analysis, prices are probably moving in wave iii or in wave iv which still opens wave v higher to complete wave c, once it is over prices will reverse back down. The level on the higher side can be 6750-6780 levels, but it will dip first somewhere close to 6330. The summation is Nifty Metal Index will dip close to 6330 levels and then will resume the major tren

MCX Crude Oil: Simple Zigzag Elliott Wave Analysis

Image
 MCX Crude Oil 60 mins chart Prices after moving up till 9990 levels on the back of ongoing conflict between Russia and Ukraine has now shown a relief. It looks like a major top is in place and the Crude Oil is set to plunge going ahead. As of now, prices failed to cross its previous high which discontinues higher highs. It is imperative to see if prices break its previous low.  Wave theory suggests, the commodity is moving in a simple zigzag pattern, where wave a is impulse followed by wave b which ended just below 61.8% and no wave c which looks to be impulse and can end up in between 61.8-161.8% of wave a to wave b. The summation is MCX Crude Oil can test the level of 7155 followed by 6620 levels over short term.

IDFC First: Elliott Wave Analysis

Image
 IDFC First 60 mins chart As shown in the above chart, prices are moving precisely in a falling channel and will continue to persists in this channel indicating that the trend will continue to be negative. Also the stock is moving in a lower highs and lower lows which support the above analysis. From Waves perspective, the stock is on the brink to complete wave C of a one corrective pattern (A-B-C). In wave C, the tricky part is whether it is completed or it is still ongoing as there is extension within extension seen. I have come up with the analysis that prices might re-test 36-35 odd levels in the form of last leg of wave C and then it will reverse (the above chart is self explanatory). The summation is IDFC First bank will face resistance at 42-3 levels forcing prices to re-test 36-35 levels over short term.

MCX Copper: Elliott Wave Analysis

Image
 MCX Copper continuous 60 mins chart From the above chart, MCX Copper is moving in a sideways direction, with the range becoming narrower going ahead. With this scenario one can possibly open triangle pattern. There is also another pattern in making which is bullish cup and handle pattern. The pattern will only be completed once it decisively breaks the level of 840. As per Elliott Wave, prices are either moving in wave ii or wave b at present. If the metal forms a triangle pattern then it will be clear that wave b has formed and wave c on the upside is pending. To form triangle, it will take time.  The other possibility is, prices will reverse and break 840 levels from here which will complete wave ii lower in the form of (w-x-y). In both the scenarios, the red metal is set to move higher, particularly above 840. The summation is MCX Copper needs to break 840 on the upside which can infuse additional buying soaring prices till 870-880 levels.

Bitcoin Revisited Part II

Image
 Bitcoin daily chart As shown in the daily chart, BTC has been moving as per my analysis. I must tell all my readers that from the month of January 2022, I am in a view that Bitcoin will test $75000 this year (2022). To add, last year in the month of July 2021, I had predicted the reversal in this crypto and was successful. This year am expecting reversal. I have written many BTC articles, click on the link to see view the articles Bitcoin Elliott Wave Analysis https://www.marketanalysiswithmeghmody.com/2022/01/bitcoin-elliott-wave-analysis.html Bitcoin Revisited https://www.marketanalysiswithmeghmody.com/2022/01/bitcoin-revisited.html Bitcoin Elliott Wave and Neo Wave Analysis https://www.marketanalysiswithmeghmody.com/2021/08/bitcoin-elliott-wave-and-neo-wave.html As per Elliott Wave, I think wave y is finally over in the form of triangle. This completion has already opened the possibility of moving prices to a new high and to my above mentioned target. The summation is BTC is very p