Posts

Hang Seng Fut: Double Correction?

Image
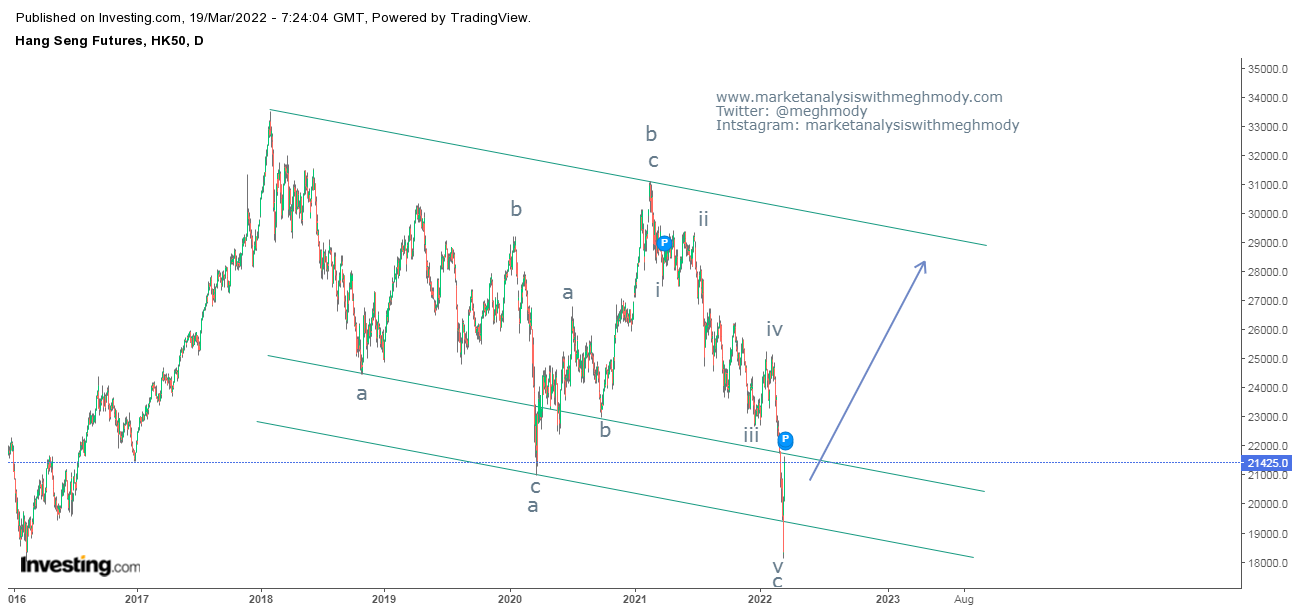
 Hang Seng  Daily fut continuous chart From the above chart, prices are moving in a lower highs and lower lows which indicates that the trend is negative. However, the index has bounced from the lower end of the falling channel which opens the possibility of a resilience. As per Elliott wave, prices have completed a corrective wave a-b-c and there is a high possibility for wave x to form. However, if prices break this falling channel then new high is imminent and the index can soar ahead. The summation is Hang Seng is likely to move up till 28000 levels over short term.

MCX Silver: Symmetrical Triangle completed

Image
 MCX Silver daily continuous contract Prices which were moving in a sideways consolidation pattern from August 2020 till dats looks to be on the brink to be completed. MCX Silver has eventually completed symmetrical triangle pattern after its wave e got completed at 73078 levels. Now there are high chances that the bullion cum commercial metal will slump from current levels. To understand lets us jump to the advance technical analysis.  As per Elliott Wave prices were moving in a symmetrical triangle and prior August 2020, the bullion was moving in a complex corrective pattern. This triangle looks to be the last leg of the ongoing upmove and will reverse going ahead. I have previously had written an article on MCX Silver, to view it click on the link https://www.marketanalysiswithmeghmody.com/2022/02/mcx-silver-in-symmetrical-triangle.html The summation is MCX Silver is poised to falter till 50000 levels over short to medium term.

GBPINR: Anticipated Happened

Image
 GBPINR 60 mins spot chart anticipated on 21st Feb 2022 GBPINR 60 mins spot chart happened on 14th March 2022 In my previous update dated 21st Feb 2022, I had mentioned, "  GBPINR is all set to plunge till 99.5-99 levels over short to medium term." The pair plunged till 99.58 at 10.30 IST, gaining 1.90% and it is looking weak going ahead - Anticipated Happened To view my previous article on GBPINR, click on the below link https://www.marketanalysiswithmeghmody.com/2022/02/gbpinr-third-correction-starts.html Prices have arrived near cluster of supports marked by arrow so one can partially book the pair at current juncture. Break of 99.5 can accelerate selling pressure going ahead but from here it seems downside is limited. As per wave theory, prices are on the brink to complete wave a of third correction and then it will start wave b higher which can move the pair back till 102 levels (spot).  The summation is GBPINR can test 99 levels but will reverse the direction to move ba

USDINR: Neo Wave Expanding Triangle Running Variation

Image
 USDINR spot daily chart In my previous article for USDINR, I was in a conclusion that there is an extracting triangle in wave y and then it can slump down towards 73.5 levels. However, prices continue to move higher thereby negating the extracting triangle. To read the article of USDINR Extracting Triangle, click on the below link https://www.marketanalysiswithmeghmody.com/2022/02/usdinr-neo-wave-extracting-triangle-in.html Here in the above chart, I think prices are now moving in a Neo Wave Expanding Triangle which is a Running Variation. This will end wave b on the higher side and wave c down will open leading it till 74.3 levels over short term. Running Variation in Expanding Triangle is more like a trending move up and looks like moving in a higher highs and higher lows. The summation is USDINR can reverse the direction any time soon and can test the level of 74.3 (spot ) over short term.

ACC: Neo Wave Diametric Pattern Anticipated Happened

Image
 ACC daily chart anticipated on 21st Feb 2022 ACC daily chart happened on 7th March 2022 In my previous update for ACC, I had mentioned that, "  ACC can move down till 1850 levels over short term, once the level of 2100 is broken decisively." Prices slumped after breaking 2100, opening well below it and made a low of 1900 which was close to my mentioned target of 1850, gaining 9.52% - Anticipated Happened To view my previous article on ACC dated 21st Feb, click on the below link https://www.marketanalysiswithmeghmody.com/2022/02/acc-neo-wave-diametric-pattern.html The current fall is an impulse and prices are now moving higher to form wave b or wave ii, so the short term bias is positive and will continue to monitor the movement as and when the wave unfolds.

Bank Nifty: Neo Wave Extracting Triangle and Forecasting

Image
 Nifty Bank 60 mins chart As shown in the above chart, prices are moving in falling channel and it has showing sign of reversal from the support of the channel. Today the fall after the shaded portion which is moving down in a small falling channel is broken thus opening positive possibilities. As per Neo Wave Analysis, I think wave a was completed at 34215 levels followed by wave b in Extracting Triangle pattern and wave c at 32150 levels. Also wave a is equal to wave c i.e. 100%. This means prices are at confluence zone of Fibonacci levels along with trend line support. So now the index can move higher from here till 37000-37300 levels over short period of time and continue wave x or can break this channel. Just like Nifty, Nifty Bank can also break channel and soar. The summation is Nifty Bank is positively poised and can move higher from current levels towards 37000-37300 over short term.

Nifty: Neo Wave Neutral Triangle and Forecasting

Image
 Nifty 60 mins chart In my previous update I had mentioned that prices are suppose to move higher but it continued to dip. Today it is showing signs of resilience as a failed pattern has eventually confirmed. To view my previous article of Nifty, you can click the below link https://www.marketanalysiswithmeghmody.com/2022/02/nifty-elliott-wave-analysis-anticipated.html In the above article I had mentioned that Nifty will soar till 17600-17800 levels, this will happen going ahead as the index has re-entered the falling channel. The falling channel was broken on 7th March and it seems that more shorts at that point was added. However, as soon as it re-entered the channel which is today, short squeeze cant be ruled out which can infuse buying pressure and fresh longs can also be seen. In my previous article if I go as per Elliott Wave I have come up with W-X-Y pattern. If I apply Neo Wave analysis I have come up with a corrective pattern a-b-c pattern where wave b is a Neo Wave Neutral Tr