Posts

Bharti Airtel: Complex Correction in making

Image
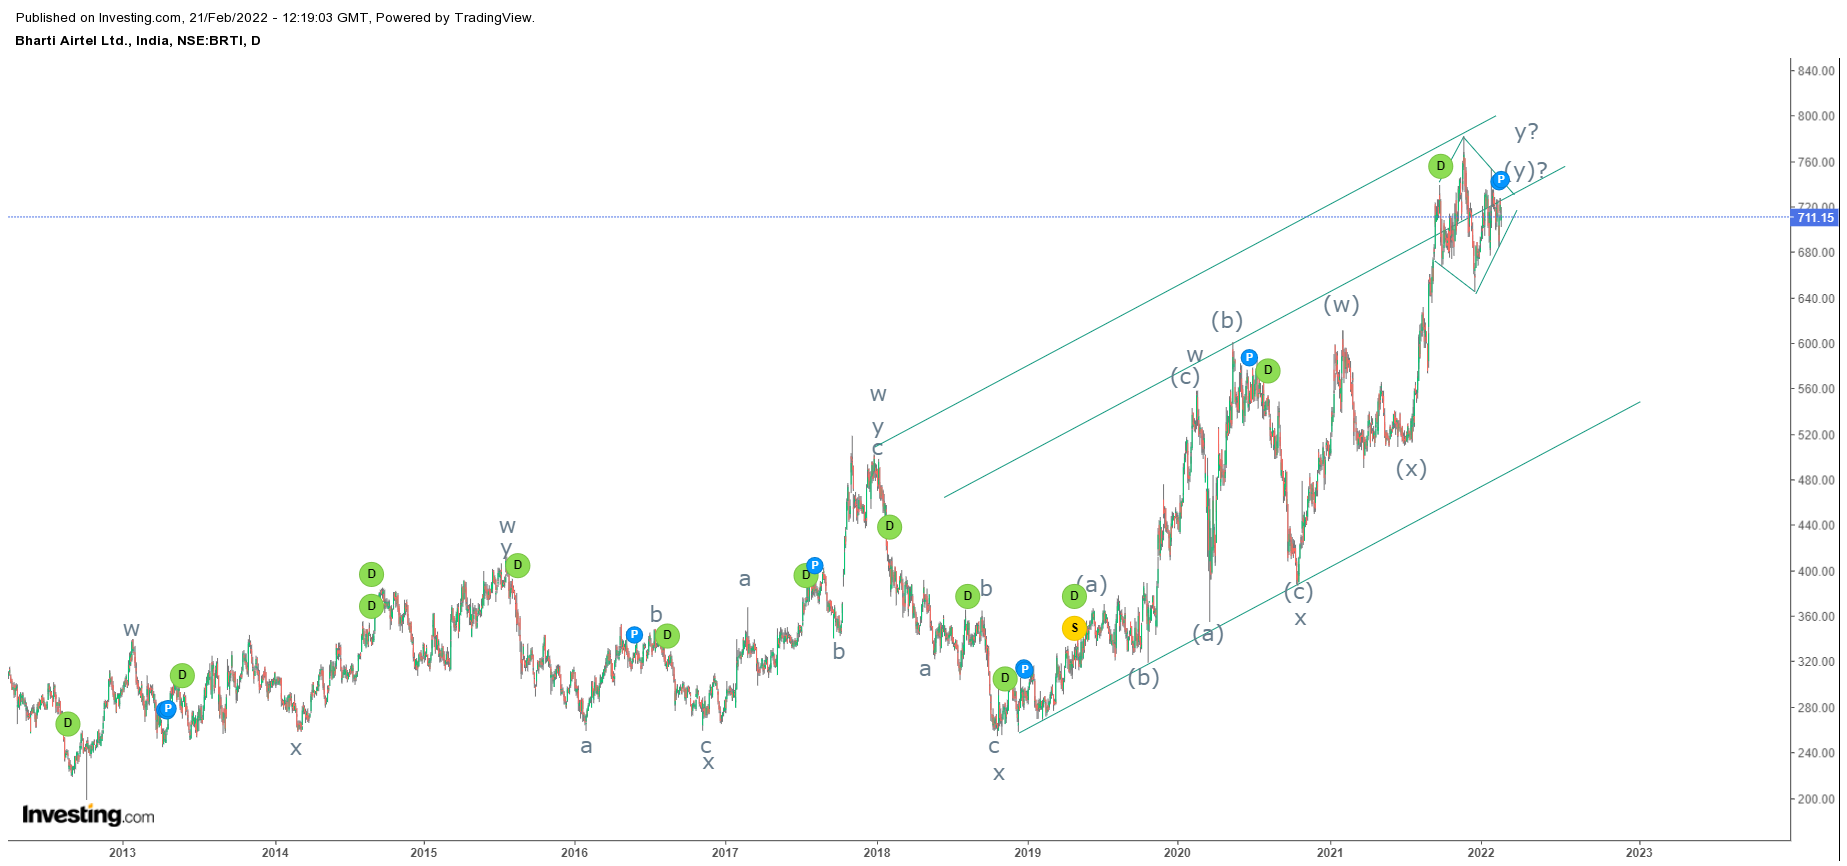
 Bharti Airtel daily chart The telecom stock is moving higher by crossing its previous high, thereby opening positive possibilities. However, prices have arrived near the resistance of the rising channel which indicates caution. Prices here are forming a distribution pattern and can reverse any time soon. From waves perspective, prices are moving in a complex correction (w-x-y). I have marked w-x-y but it can also be w-x-y-x-z counting. I think in my wave y prices are forming Neo wave diametric pattern (a-b-c-d-e-f-g), where wave g is in making and once it is over, prices will correct thereby completing the complex correction. The summation is Bharti Airtel can move sideways from here and then reverse correcting till 620-610 levels over medium term.

EURINR: Elliott Wave Analysis

Image
 EURINR 60 min spot chart EURINR is moving in a lower highs and lower lows which opens negative possibilities. Recently it tested the level 86.5 (spot) and thereby moving down in a stealth downtrend. The pair is negatively poised and it is set to move down from current levels. As per Waves perspective, prices are moving in corrective wave where it completed wave a in complex correction, wave b in regular flat pattern and wave c has just opened up. This wave c can drag prices near till 81 levels over short term. The summation is EURINR is negatively poised and can test the level of 81 over short term.

ACC: Neo Wave Diametric pattern

Image
 ACC daily chart As shown in the above chart, prices are moving in a sideways direction after a stupendous rally, this sideways pattern are a sign of caution as there are high chances of a distribution pattern happening at higher levels. Wave theory suggests that, prices are moving in a Neo Wave Diametric pattern, which is a seven leg pattern (a-b-c-d-e-f-g) and in wave g there is a high possibility of a triangle pattern. Once wave g is over, prices are expected to falter till 1850 levels. The summation is ACC can move down till 1850 levels over short term, once the level of 2100 is broken decisively.

Crude Oil : Wave 4 to start?

Image
 Crude Oil 60 mins chart  Prices are moving in a higher highs and higher lows and is precisely moving in a rising channel. However, the black gold has faced the resistance of the channel and it is reversing, breaking the smaller supports. The short term trend is now negative and prices can retrace towards crucial  supports in coming trading days. From Waves perspective, Crude Oil has completed wave iii of impulse and it is all set to dive to complete wave iv. This wave iv can test $86 to 84 $ over short term where wave (iv) of wave iii is placed. If it holds this level there is a high possibility for wave v to open. The summation is Crude Oil can move down till $86-$84 over short term.

Tata Steel: Elliott Wave Cycle

Image
 Tata Steel daily chart Tata Steel is moving in a higher highs and higher lows which is a positive sign and can continue to do so once the correction which is ongoing will complete. The intermediate trend is negative as prices are correcting but the longer time frame is positive. There are also high chances that the longer time frame change to negative from positive, only if it breaks the important support of 750 levels. As of now the focus will be the minor correction which is ongoing and can move down till 1000 levels over short to medium term. As per wave theory, prices are moving in correction pattern after forming wave 3. This correction pattern probably introduced wave x, converting it into complex correction (a-b-c-x-a-b-c). If wave x is formed at 1258, then prices are all set to plunge till 1000 levels. On a longer time frame I am opening two scenarios Scenario 1: Prices are moving in impulse pattern where wave 1, wave 2 and wave 3 is over after that prices are moving in wave 4

MCX Silver in Symmetrical Triangle

Image
 MCX Silver daily continuous chart From the above daily chart, prices are moving in a sideways direction and it seems the range which it was earlier moving in narrowing, thus opening the possibility of symmetrical triangle pattern. As per Wave theory, prices are moving in complex pattern where the last leg is in symmetrical triangle pattern where it is in the final leg of triangle i.e wave e. in wave e there is a possibility of a triangle as well, once this pattern is complete, prices are expected to tumble. The summation is MCX Silver is all set to nose dive once the level of 60000 is broken which can accelerate selling pressure tumbling till 46000-45000 levels.

Gail: Anticipated Happend

Image
 Gail 60 mins chart anticipated on 9th Feb 2022 Gail 60 mins chart happened on 13th Feb 2022 In my previous update I had mentioned that, " Gail is negatively poised an can falter near till 140-138 levels over short term." Prices plunged below 138 levels thereby achieving my mentioned level - Anticipated Happened The stock has completed wave b as expected in irregular flat pattern and it is all set to move higher in the form of wave c which can move till 152-155 levels over short to medium term. The summation is Gail looks positive over medium term to test 152-155 levels.