Posts

USDINR: Anticipated Happened

Image
 USDINR 60 mins spot chart anticipated on 24th Jan 2022 USDINR 60 mins sport chart happened on 15th Feb 2022 In my previous update of USDINR, I had mentioned, "  USDINR is firmly positive and can move near till 75.6-75.7 levels once the level of 74.7 is decisively crossed and sustained." Prices achieved the above mentioned level of 75.7 (spot) on 15th Feb 2022 and reversed from there - Anticipated Happened. To read my previous article on USDINR: Inverse Head and Shoulder Pattern click on the below link https://www.marketanalysiswithmeghmody.com/2022/01/usdinr-inverse-head-and-shoulder.html Currently prices are moving in complex correction which is (a-b-c-x-a-b-c) this can be wxy eventually or can be simple a-b-c and the current fall is wave x. In both the scenarios, prices will continue to surge and possibility is high it can transcend its ATH.
GBPINR: Anticipated Happened

Image
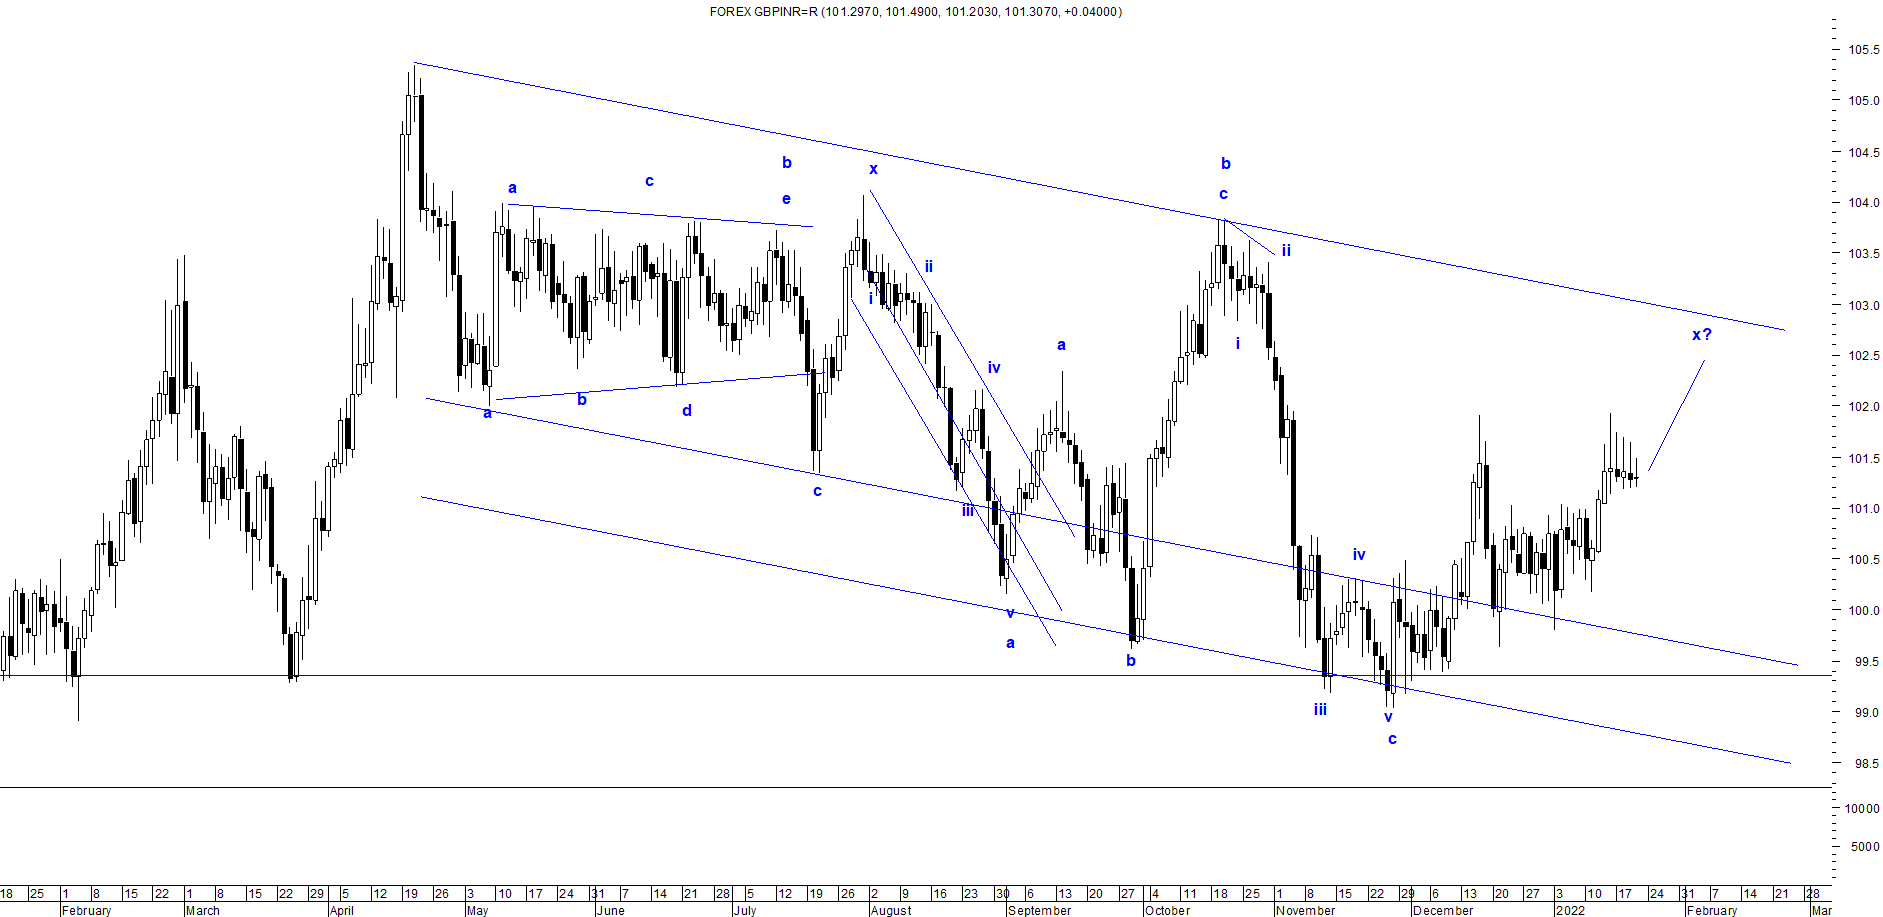
 GBPINR 60 mins chart anticipated on 20th January 2022 GBPINR 60 mins chart happened on 11th February 2022 In my previous update for GBPINR, I had mentioned that, " GBPINR is mildly positive and can find resistance at 102-102.5 levels over short term." The pair moved as per the prognostics and reached the mentioned level of 102.5 on 11th February 2022 - Anticipated Happened. To read my previous article on GBPINR dated 20th January, you can click on the below mentioned link  https://www.marketanalysiswithmeghmody.com/2022/01/gbpinr-triple-correction.html GBPINR was trading in a corrective fashion after bouncing form the lower end of the falling channel. Prices were likely to move either in three waves or complex waves towards it resistance.

EURINR: Anticipated Happened

Image
 EURINR 60 mins chart anticipated on 2nd Feb 2022 EURINR 60 min chart happened on 10th Feb 2022 As mentioned in my previous update about EURINR, the pair moved in similar fashion as expected. I had mentioned on 2nd Feb about this pair, " EURINR is all set to move higher till 86.4-86.6 over short to medium term with support at 83.2." The pair made a high of 86.3 on 10th Feb 2022 and is now showing signs of reversal. It is still early to come to a conclusion that the pair has reversed - Anticipated happened. To read my previous article on EURINR: Elliott Wave Analysis you can click on the below mentioned link https://www.marketanalysiswithmeghmody.com/2022/02/eurinr-elliott-wave-analysis.html Prices after forming wave a and wave b in a regular flat pattern, it was expected that wave c will come close to wave a end , this has exactly happened in the above chart and I was successful in capturing the trend.

MCX Metaldex: Anticipated Happened

Image
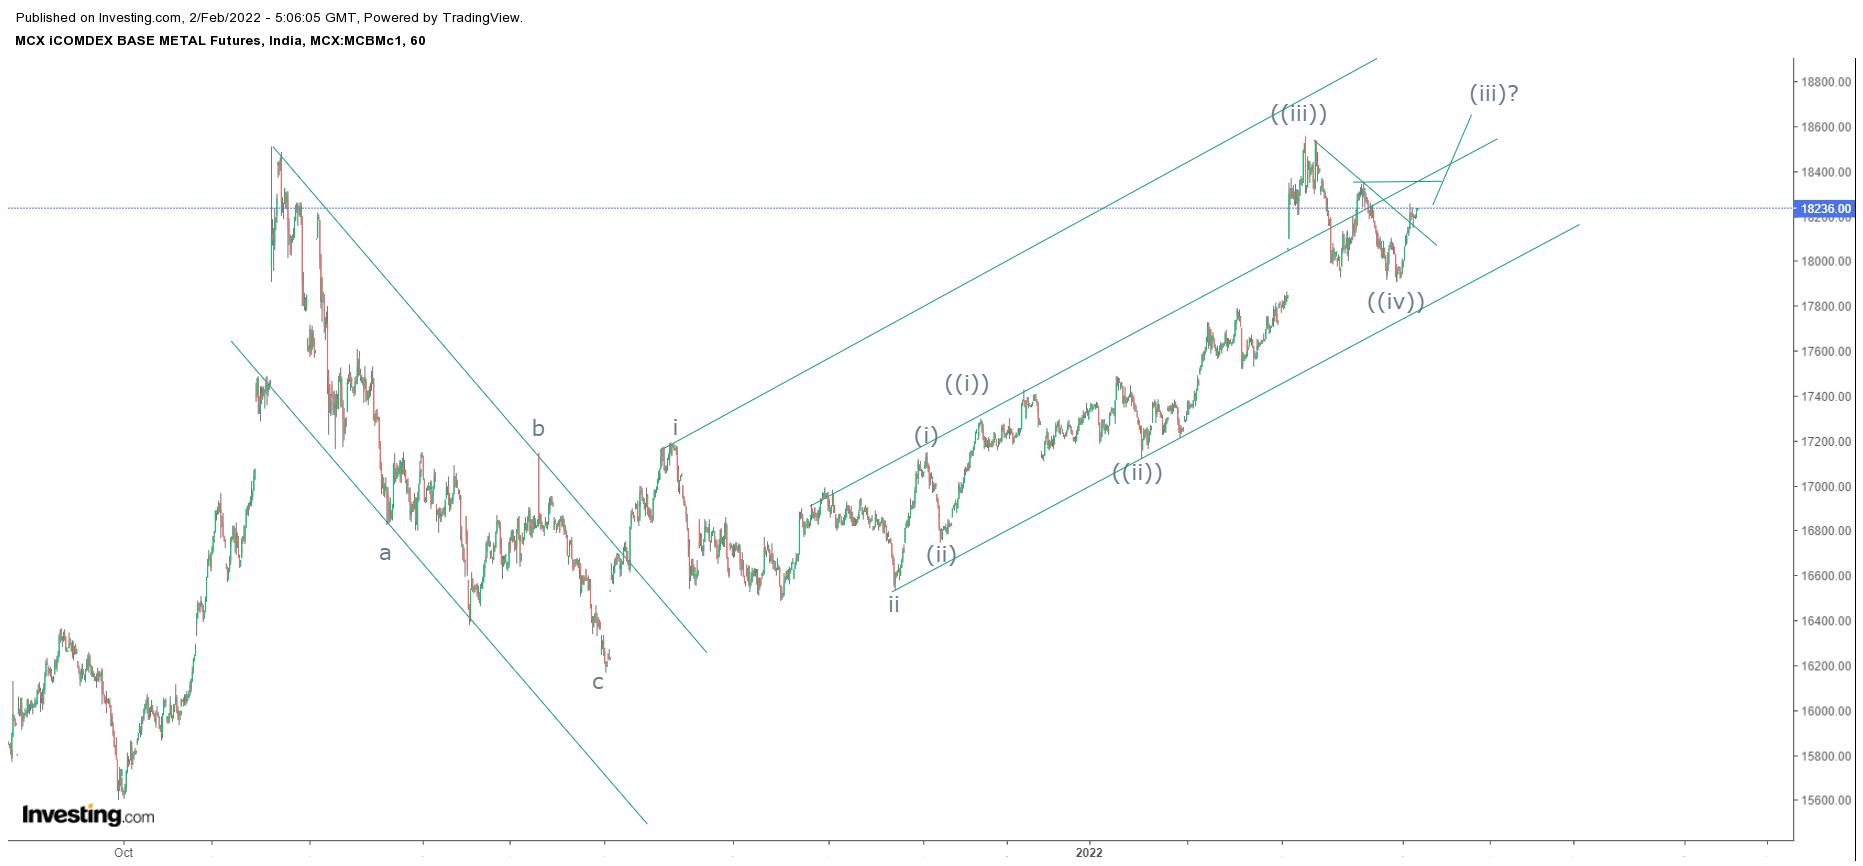
 MCX Metaldex 60 mins anticipated on 2nd Feb 2022 MCX Metaldex 60 mins happened on 9th Feb 2022 In my previous update I had mentioned that, " MCX Metaldex is positively poised and can surge till 18600-18700 levels as far as 17850 is protected." Prices made a high of 18900 levels in the opening session today, thereby achieving my above mentioned level- Anticipated Happened. Here is the link of my previous article https://www.marketanalysiswithmeghmody.com/2022/02/mcx-metaldex-elliott-wave-analysis.html The index is moving in wave ((v)) of wave (iii) which is likely to be extended and can soar further. I am monitoring the price movement and will update timely.

Gail: Elliott Wave Analysis

Image
 Gail 60 mins chart From the above chart, prices are moving in a sideways direction esp in a range of 150-138 levels. Recently prices tested the resistance of the range and it is now all set to test the support of the range. As per Wave Theory, prices are moving in a corrective pattern, where it completed wave a at 148.5 levels followed by wave b in a irregular flat pattern which is still ongoing. In wave b it has completed wave a and wave b and currently moving down in impulse as wave c of wave b, which can terminate at 140-138 levels. The summation is Gail is negatively poised an can falter near till 140-138 levels over short term.

SAND: Elliott Wave Analysis

Image
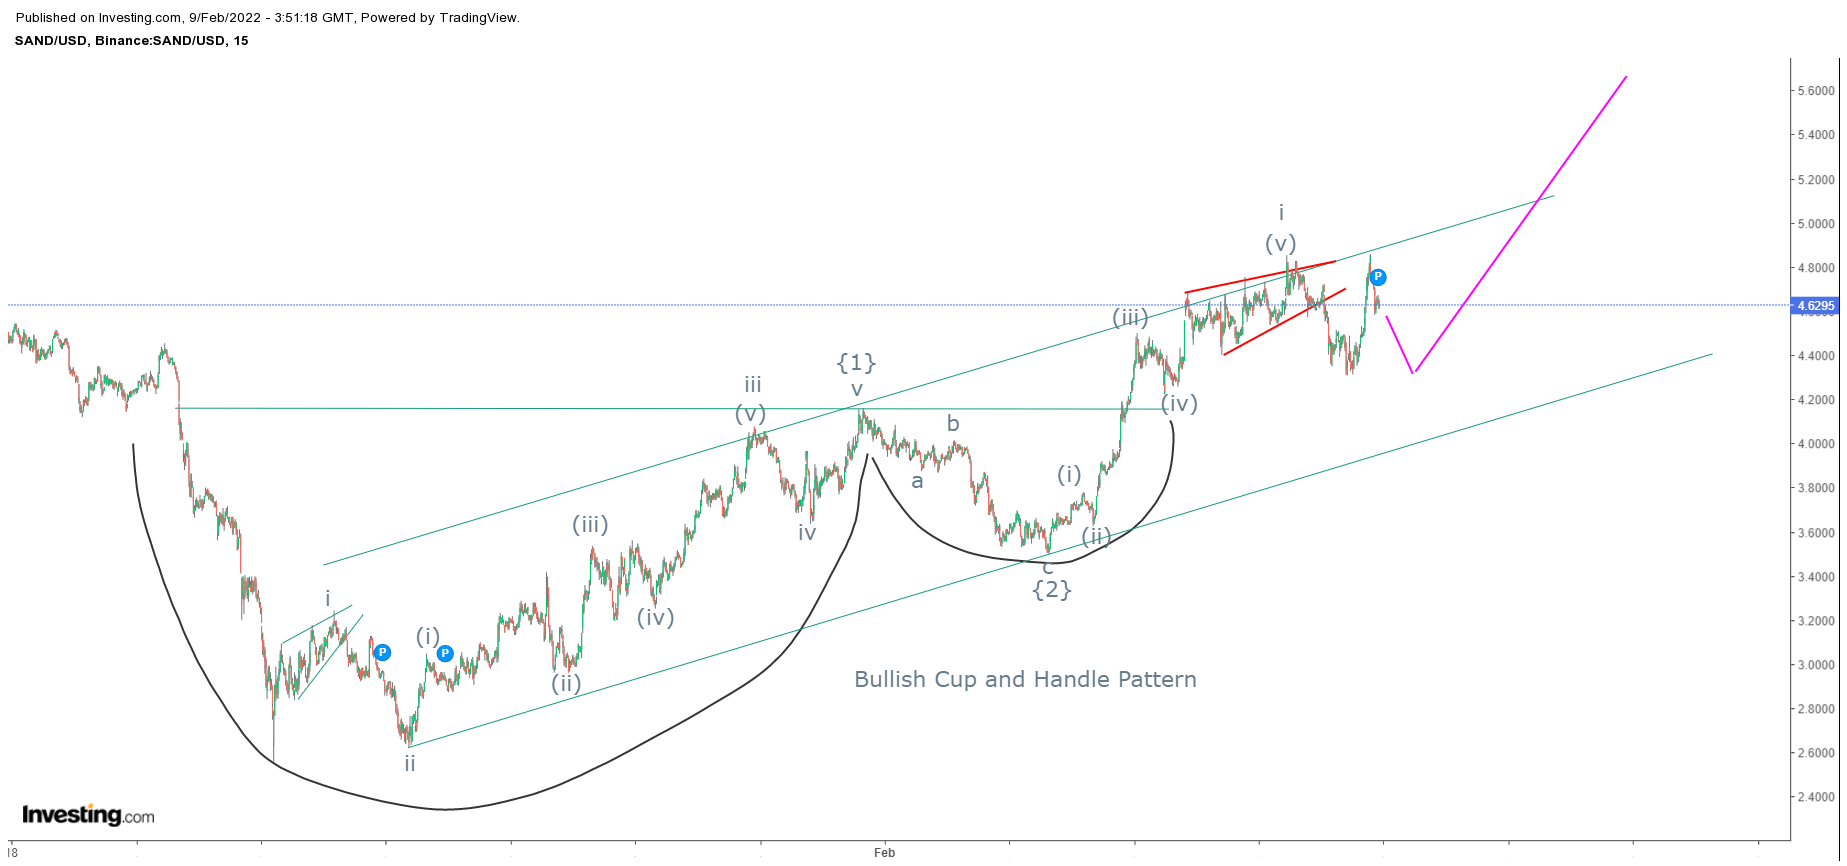
 Sand/USD 15 mins chart  As shown in the above chart, prices are moving in a higher highs and higher lows which is a positive sign and can move higher as far as it persists in the rising channel. Also the cryptocurrency has completed bullish cup and handle pattern thus opening further positive possibilities. The level of $4.2 will act a a crucial support (polarity reversal). Wave theory suggests, prices have started wave {3} where wave i of wave {3} is completed, this means wave ii can dip prices near to $4.2 followed by wave iii of wave {3}. The summation is SAND/USD is all set to soar near till $5.6-6 over short to medium term.

Nifty: Elliott Wave Analysis

Image
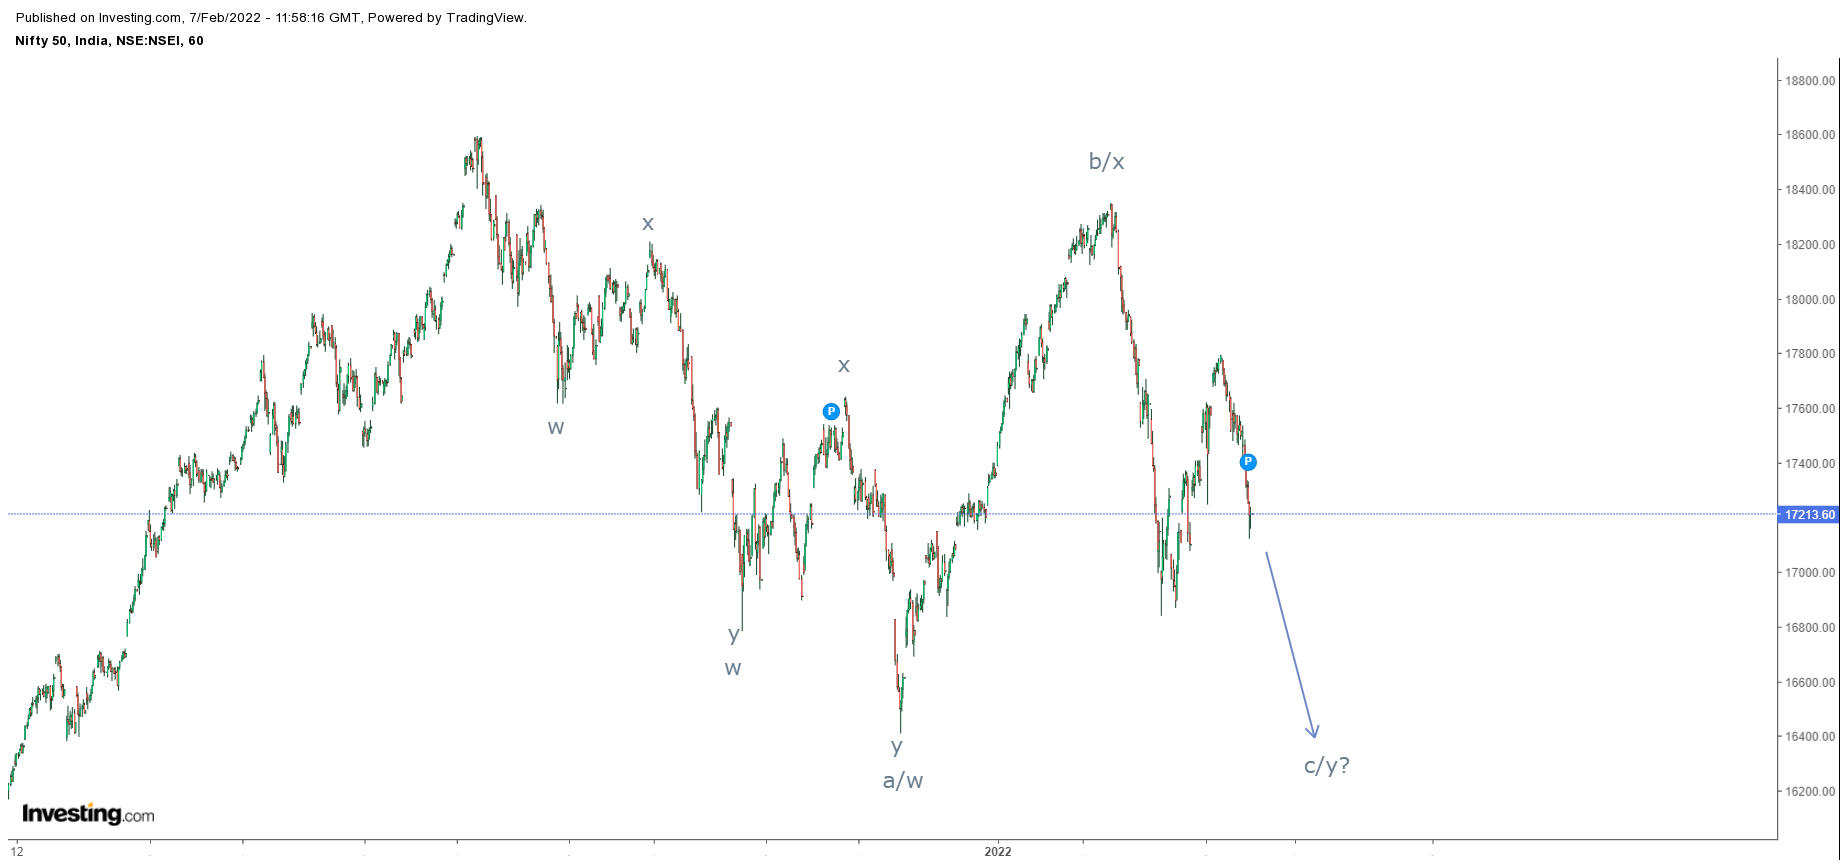
 Nifty hourly chart As shown in the above chart, Nifty is moving in a complex correction and to decode it, I have come up with plausible scenario. To put it in a basic way, prices have failed to cross its previous all time high and has started moving lower. To embellish prices are as of now moving in a rage of 18800-16400 levels. Recently it managed to test its previous highs or near to it, now there are high chances for the index to test the support. From Waves perspective, prices are moving in a (w-x-y) pattern, where prices have completed either wave a/w at 16400 followed by wave b/y and now it is moving down in form of wave c/y. This current ongoing wave can test 16400-16000 levels over short term. The summation is Nifty is all set to plunge to test 16400-16000 levels over short to medium term.