SAND: Elliott Wave Analysis
Sand/USD 15 mins chart
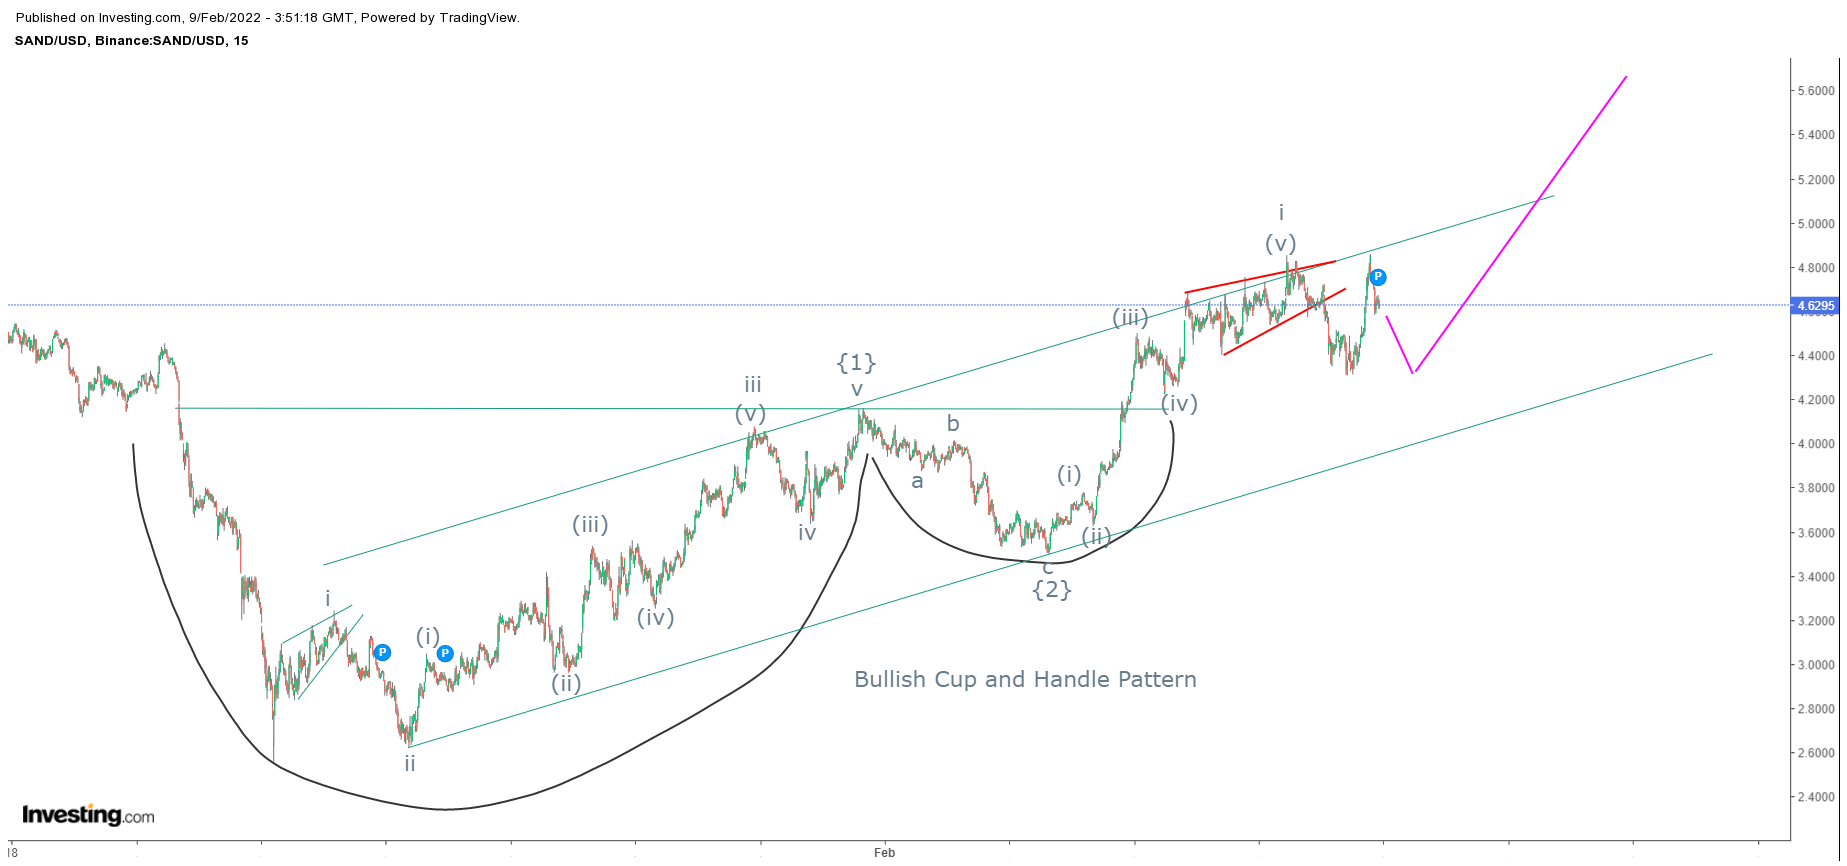
As shown in the above chart, prices are moving in a higher highs and higher lows which is a positive sign and can move higher as far as it persists in the rising channel. Also the cryptocurrency has completed bullish cup and handle pattern thus opening further positive possibilities. The level of $4.2 will act a a crucial support (polarity reversal).
Wave theory suggests, prices have started wave {3} where wave i of wave {3} is completed, this means wave ii can dip prices near to $4.2 followed by wave iii of wave {3}.
The summation is SAND/USD is all set to soar near till $5.6-6 over short to medium term.


Comments