MCX Silver in Symmetrical Triangle
MCX Silver daily continuous chart
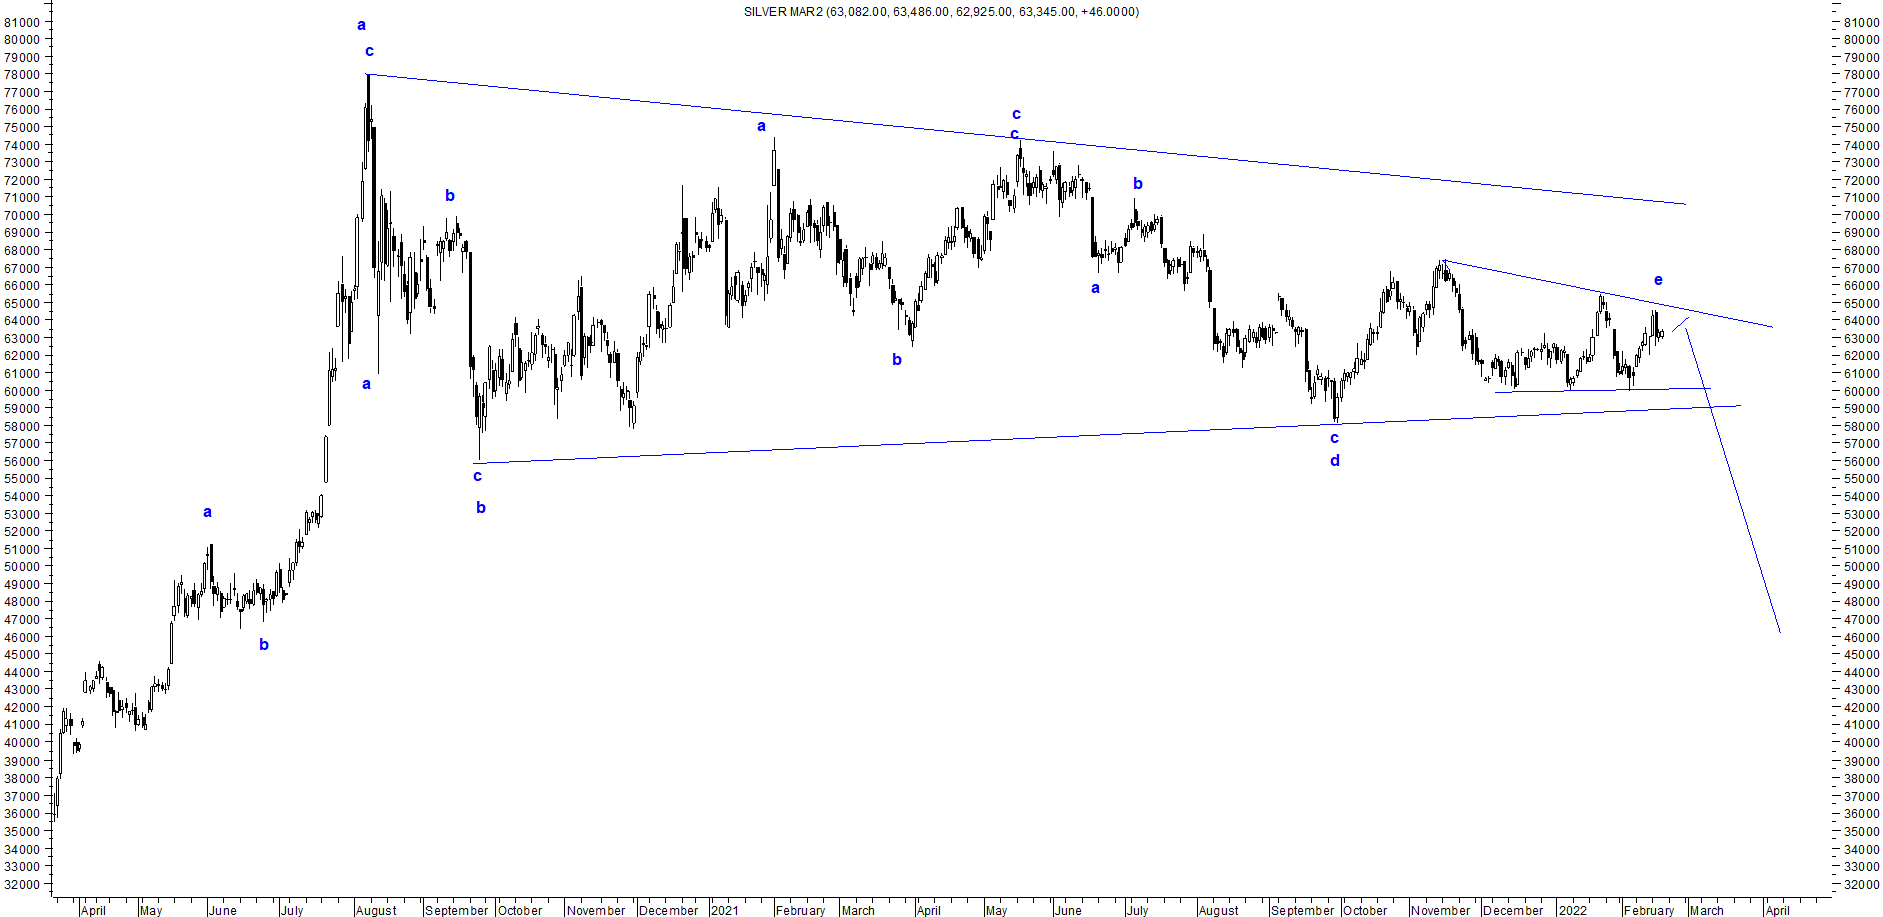
From the above daily chart, prices are moving in a sideways direction and it seems the range which it was earlier moving in narrowing, thus opening the possibility of symmetrical triangle pattern.
As per Wave theory, prices are moving in complex pattern where the last leg is in symmetrical triangle pattern where it is in the final leg of triangle i.e wave e. in wave e there is a possibility of a triangle as well, once this pattern is complete, prices are expected to tumble.
The summation is MCX Silver is all set to nose dive once the level of 60000 is broken which can accelerate selling pressure tumbling till 46000-45000 levels.


Comments