Posts

Ethereum: Elliott Wave and Neo Wave Diametric pattern

Image
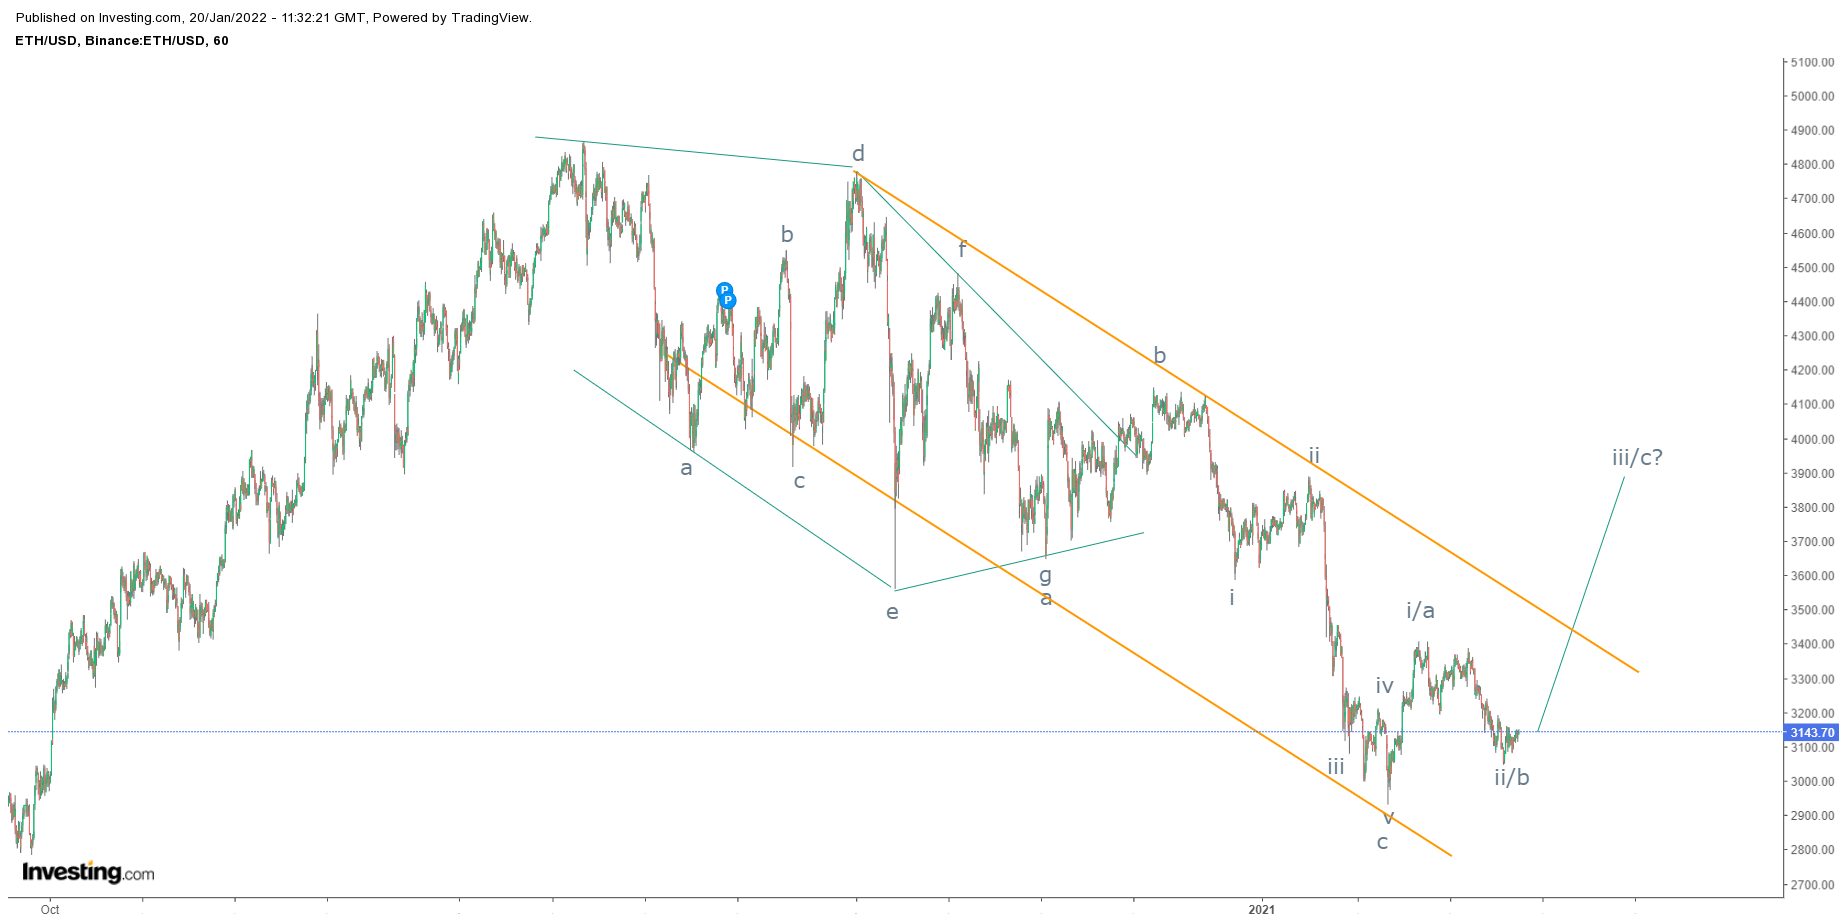
 ETH/USD hourly chart As shown in the above chart, prices are moving in a lower highs and lower lows and it persists in the falling channel. However, the recent low is protected and prices are likely to move higher from current levels which can give bullish break in falling channel pattern. From Waves perspective, prices moved down in a Neo Wave diametric pattern, followed by three waves up to complete wave b and then wave c lower which completes one corrective pattern. After completing the corrective cycle there are high chances for this crypto to reverse. The summation is Ethereum is all set to reverse and can test the first resistance placed at $3900 over short to medium term.

GBPINR: Triple Correction?

Image
 GBPINR Spot daily chart As shown in the above chart, prices are moving in a falling channel which gives an indication that the trend is down. Recently, cable has shown resilience from the support of the channel which can move back towards the resistance of the pattern. many analysts believe that the uptick in price is due to rise in inflation in UK but technically it was hinting ahead of time. From Waves perspective, prices are moving in a double correction which can now be turned into triple correction (a-b-c-x-a-b-c-x-a-b-c). Currently prices are in the second wave x and it is still forming which can move till 102-102.5 (spot). The summation is GBPINR is mildly positive and can fin resistance at 102-102.5 levels over short term.

Nifty Bank: Elliott Wave Analysis

Image
 Nifty Bank hourly chart From the above chart, Nifty Bank is moving in a higher highs and higher lows and it is precisely moving in a rising channel which is a positive sign. Recently prices have retraced back to test the support of the channel, any bounce from current levels will open further positive possibilities. As per Wave theory, prices are moving in am impulse fashion, in which it has probably completed wave iv in a flat pattern and it is on the brink to start wave v which can move up near to 39900-40000 levels. The summation is Nifty Bank is all set to move higher over short term near 39900-40000 levels, as far as 37400-37200 is intact on closing basis.

MCX Crude Oil Anticipated Happened

Image
 MCX Crude Oil daily chart anticipated on 28th December 2021 MCX Crude Oil daily chart happened on 19th January 2022 In my previous article on MCX Crude I had mentioned that, "  MCX Crude is positively poised and can move higher near to 6100 followed by 6400 over medium term." Within twenty trading sessions MCX Crude has achieved my above mentioned level- Anticipated Happened To read the previous articles on MCX Crude click on the below links MCX Crude Anticipated Happened and Elliott Wave Analysis https://www.marketanalysiswithmeghmody.com/2021/12/mcx-crude-oil-anticipated-happened-and.html MCX Crude Oil Elliott Wave Analysis https://www.marketanalysiswithmeghmody.com/2021/12/mcx-crude-oil-elliott-wave-analysis.html It will be important to see  how this wave will unfold, I will monitor the movement and keep you all posted.

Bitcoin: Elliott Wave Analysis

Image
 Bitcoin daily chart As shown in the above chart, Bitcoin is moving in a range of $65000-$35000 levels and it seems that prices will continue to move in this range once the lower extreme of the range is tested. To understand it more precisely, it is better to know where the support and resistance levels are placed. Currently, prices are hovering near crucial support of $40000 levels (shaded area). As far as this level is intact there is a limited downside. However, decisive break of the above mentioned level will plunge price towards $35000 over short term. From Waves perspective, prices are moving in a irregular flat pattern but with slight complication. So this cannot be a irregular flat pattern as I can see only (3-3-3) so I will open running triangle as my other favorable probability. If triangle is not formed I will sum up with (w-x-y). I will monitor the counts and will keep you all posted. Also the final outcome after the pattern is complete will lead Bitcoin to new highs minimu

MCX Crude Oil Anticipated Happened and Elliott Wave Analysis

Image
 MCX Crude Oil daily continuous contract Anticipated on 7th December 2021 MCX Crude Oil daily continuous contract Happened on 27th December 2021 From the above chart, MCX Crude Oil which was trading at below 5500 in the first week of December 2021, I had mentioned that, "  MCX Crude Oil is all set to test the level of 5700-5800 over short to medium term as far as 5000 levels are protected on the lower side." - Anticipated Happened. Crude Oil touched 5700 on 27th December 2021 thereby achieving my first target. To read the previous article on MCX Crude Oil, you can click on the link here https://www.marketanalysiswithmeghmody.com/2021/12/mcx-crude-oil-elliott-wave-analysis.html As per Elliott Wave theory, I have counted the recent rally as wave b which can be a flat, the minimum criteria of flat is at 6100 which will eventually turn into normal flat pattern followed by irregular. My next target after it surpasses 5800 will be 6100 followed by 6400. The summation is MCX Crude i

Nifty Bank: Elliott Wave Analysis

Image
 Nifty Bank hourly chart As shown in the above hourly chat, prices have given a bullish break in a falling channel which is a positive sign and can move higher from current levels. Currently it is facing the resistance near the rising channel, which I think will be taken out in couple of trading sessions. From Waves perspective, prices have completed a corrective wave (a-b-c) and has opened another corrective wave which is likely to move higher from current levels. In the ongoing wave, it has completed wave a and wave b and in wave c it is done with wave i and probably wave ii this opens wave iii higher followed by iv and v . The summation is Nifty Bank is expected to test 40000-40400 levels over short to medium term with support placed at 36000.