Posts

MCX Silver Elliott Wave Analysis

Image
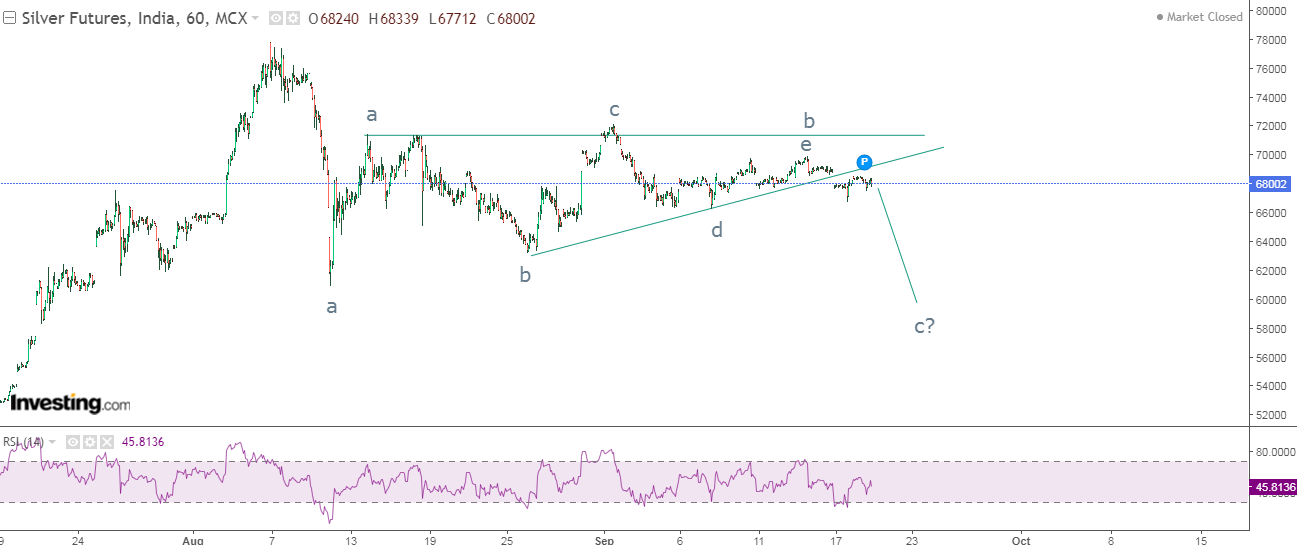
 MCX Silver hourly continuous fut chart In daily chart of Silver, prices which were moving in a sideways trend has now given a directional breakout. This also opens the possibility that it will plunge in day to come in. the next support lies near 61000 levels which can be tested. RSI has also relieved from oversold terrain and is all set to reverse the direction. From Waves perspective, the pair completed triangle pattern (a-b-c-d-e) and has started wave c lower, the possibility to test the end of wave a which is placed at 61000 is likely. The summation is Silver is firmly bearish and can move down to test 61000 levels with resistance at 70100 (closing basis). Education Learn Technical Analysis in our 4 month course to help you to identify better trade setups. This course will be conducted every twice in a week for around 2 hours. This theory can be applied on all free floating markets. In this course learn from basic to advance and the fees for the same will be Rs. 12,000/- ...

Nifty Anticipated Happened

Image
 Nifty hourly chart anticipated on 12th Sep 2020 Nifty hourly chart happened on 16th Sep 2020 In my previous update, I had mentioned that, “ Nifty can move down to test 11350 it can be utilized as a buying opportunity with a support at 11290 and on the upside it can test 11600-11620 price zone .” Nifty made a low of 11383 and thereafter it made a high of 11618 which was price range mentioned last week, thus anticipated happened. Here is the link to my previous article on Nifty click on it. https://www.marketanalysiswithmeghmody.com/2020/09/nifty-elliott-wave-analysis_12.html Elliott Wave and other Wave theories is not simple to practice even though it is very simple in theory, but you can learn from me during this lock down in my one month webinar exclusively focused on Wave thoery and its practical application. This theory is a universal theory and can be applied on all free floating markets. Hurry, next batch starts from October 2020. Details are mentioned below. Education Lea...

Coal India Elliott Wave Analysis

Image
 Coal India daily chart Coal India hourly chart In the above daily chart, the energy stock is moving in a lower highs and lower lows and also moving precisely in falling channel. At present it is hovering near the resistance of the channel and there a high probability that it will move down from current juncture. However, RSI has approached near to the oversold terrain, this is the level from it has reversed several times. In the hourly chart, prices have completed symmetrical triangle pattern and has broken all its previous supports, thus opening negative possibilities. There are high chances that prices will continue to plunge till 115-112 levels over short term. As per Wave theory, the stock is moving in a-b-c-x-a-b-c- pattern in which it has completed wave b in triangle and so wave c on the downside is pending which already has started. The summation is Coal India is negatively poised and can drag till 115-112 price zone over couple of weeks with resistance at 128 on clos...

Tata Steel Anticipated Happened

Image
Tata Steel Anticipated on  6th September 2020 Tata Steel Happened on 10th September 2020 In my previous update on Tata Steel, I had mentioned that, " Tata Steel is likely to falter till 410 followed by 400 in coming weeks. The stock is negatively poised and will correct to test its immediate supports." Prices made a low of 386 thus achieving my both the targets of 410 followed by 400 levels - Anticipated Happened. Here is the link of my Tata Steel Article click on the link https://www.marketanalysiswithmeghmody.com/2020/09/tata-steel-elliott-wave-analysis.html From Waves perspective I had mentioned that, prices are likely to correct in form of wave iv after completing wave iii in an extension. This wave on the downside is expected to be steeper in nature and so the fall has to be faster in comparison with time. Prices can down faster and marked a low of 386, this is how alteration (guidelines of impulse wave) works in impulse wave. Education Learn Technical Analysis in our 4...

Nifty Elliott Wave Analysis

Image
 Nifty daily chart Nifty hourly chart In my previous update, I had mentioned that, Nifty is expected to plunge till 11100. However, it made a low of 11185 and reversed which opens another scenario of the market direction. In the daily chart, after marking low of 11185 last week, prices rebound from the lows and closed higher at 11455 levels thus showing strength. There is no doubt that short term trend has changed from negative to positive, but this can also not be ruled out that the medium term trend continues to be negative. I think it is likely for the index to test the rising trend line which was earlier acting as a support and now a resistance. RSI holds the center line which gives positive sign. As shown in hourly chart, prices surged by giving bullish trend line break and also crossed its previous high (marked by horizontal black trend line) thus opening positive possibilities. Also moving above its previous high discontinues lower highs and lower lows. There is a possib...

ICICI Bank Elliott Wave Analysis

Image
 ICICI Bank daily chart ICICI Bank hourly chart In the above daily chart, the banking stock is moving in a sideways trend with the extremes placed at 330 on the lower side and 400 on the higher side. The stock made an attempt to move above it and marked a high of 425, but it was short lived and thus it re-entered the range making it possible to test the lower extreme. RSI is below the center line which is a negative sign. In the hourly chart, prices are showing signs of resilience by exhibiting positive divergence in RSI. Prices have retraced more than 65 points from the top and so the possibility of a bounce back cannot be ruled out. RSI has relieved from the oversold zone and can move up from here. As per Wave theory, wave a of one higher degree is completed which opens wave b of same degree up. In which wave a is ongoing within wave a and wave b is over and so wave c is pending on the upside. The summation is ICICI Bank is set to surge till 378-380 levels where cluster of ...

JPYINR Elliott Wave Analysis

Image
 JPYINR daily continuous fut chart JPYINR hourly continuous fut chart In daily chart of JPYINR, the pair is hovering near the cluster of supports and if this support is intact there can be a bounce back which can soar prices near till resistance of the sideways trend. RSI is also showing signs of reversal all indicating that a bounce back can’t be ruled out. From hourly chart, bounce from the lower end of the support will give an indication that prices will continue to remain in this trend which will also define the resistance zone and possible exit levels. The bias from current juncture is positive. From Waves perspective, the pair is moving in (a-b-c-x-a-b-c) where it has completed wave c of second correction and from here there are two probabilities either there can be wave x coming from here of wave b of one higher degree is over at c and wave c of one higher degree will start which can move above the end of wave a of one higher degree. The summation is JPYINR is all set ...