Nifty Elliott Wave Analysis

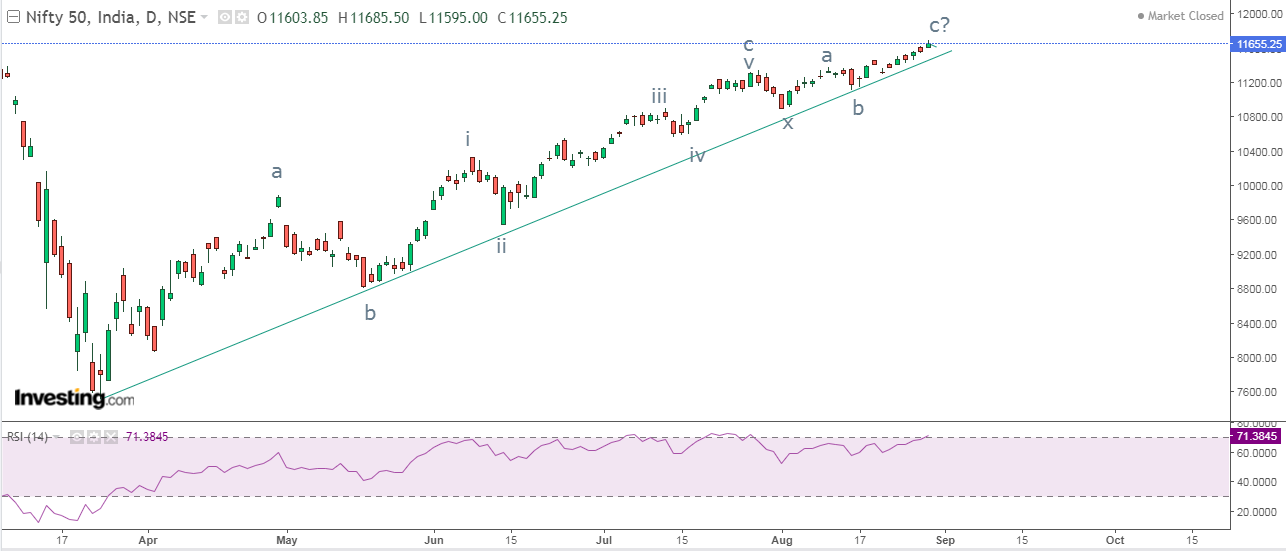
Nifty daily chart Nifty hourly chart In my previous update, I had mentioned that, “ Nifty is positively poised but a slight correction cannot be ruled out which can retrace till 11500 followed by wave v higher which can cross 11700 and mark 11750-11790 levels. Also if the level of 11450 is broken then an important top is in place .” Nifty broke the support of 11450 which infused selling pressure breaking all the significant supports and forming an intermediate top at 11800.- Anticipated happened In the daily chart, the index opened with a gap up on Monday and marked a high of 11800, it was unable to sustain higher and as a result it reversed on the same day. The reversal was so strong that the rising trend line which was acting as a crucial support was broken and closed below it on the last day of the week, thus giving a bearish break. Daily RSI continues to go down after exhibiting negative divergence. Nifty and Nifty Bank has formed a strong reversal candles in weekly chart, w