Posts

MCX Natural Gas: Neo wave Analysis

Image
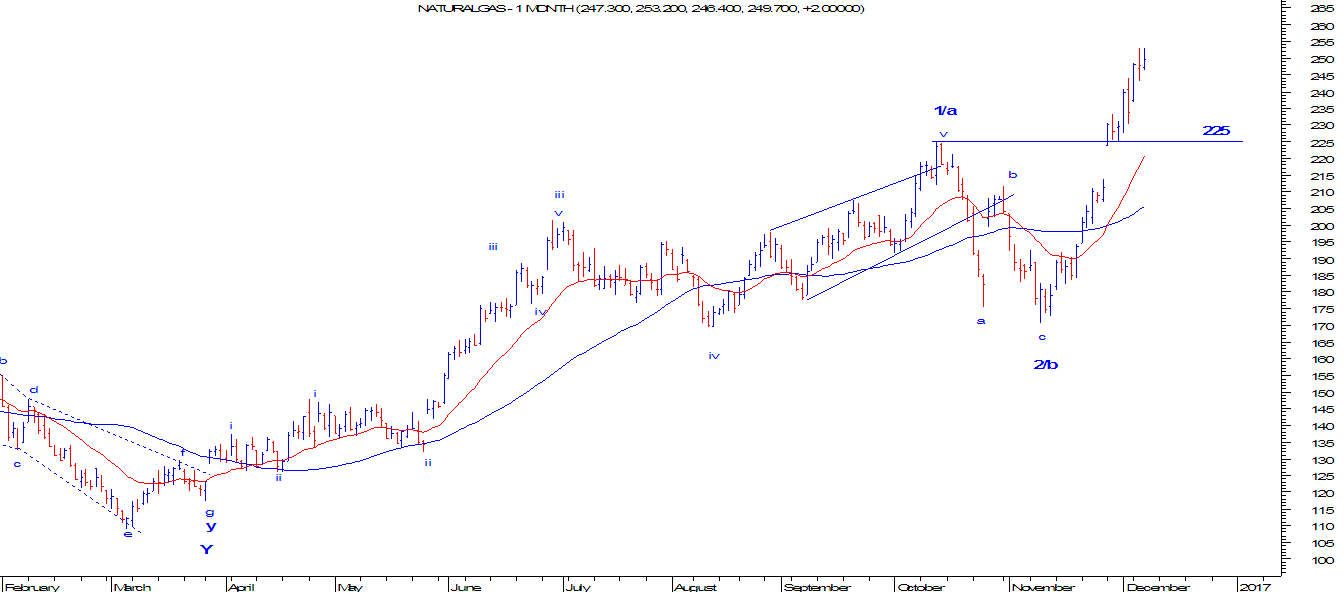
NG Daily Continuous chart  From the above daily continuous chart of Nat Gas, it is clearly visible that prices broke the lower band of a sideways pattern. NG which was moving in a consolidation pattern of 200-185, has finally come out of it by breaking the support of 185, thus opening negative possibilities. As per Neo Wave analysis, after forming a top of 264 in the year 2016, prices moved in a three wave structure down, Where the first wave was a three wave structure, second wave was a five, forming an extracting triangle and the last will be the impluse wave which can drag prices further lower. In short, the bias for NG remains firmly negative as prices will moved down till ..... odd levels in near term. Learn Elliott Wave and Neo Wave in a two day seminar, so that you can get the desired calculation of the above asset class. For more details mail me meghmody@gmail.com

Wave theory on MCX Copper

Image
MCX Copper (Daily continuous chart)   Not so early I had written  MCX Copper Elliott Wave Forecasting, but was very skeptical on its future movements. In the previous article of Copper, I had mentioned that,   “As per Wave theory, after steep rise from 300 to 415 levels, prices are in the making of Flat pattern (3-3-5). As of now it seems that wave c of the flat pattern is over and prices are set to resume the uptrend. However, break of 365 will open other possibilities, which can eventually turn into another pattern.” Prices failed to form a flat pattern and eventually turned into complex correction pattern (w-x-y). Where in y it took more time and formed a bow and tie diametric pattern which comprises of (a-b-c-d-e-f-g) seven legs. After completing wave y in diametric, prices have started moving in a positive direction and can move till  or above it. In short, the bias for the red metal is firmly positive as it was before as it is expected to reach near 415

MCX Nickel to change its trend

Image
MCX Nickel (Daily Continuous chart) MCX Nickel tumbled from the top of 816 levels to mark a low of 558 in the month of June 2017. However, the trend which was earlier negative have shown a reversal. It will be early to judge the reversal but with the combine techniques of advance and basic technical studies, it is easier to jump on the conclusion. From the above daily continuous chart, the industrial metal has started forming a higher highs and higher lows. Prices which made a high of 586 (showed blue line) was crossed and later when it corrected it halted above 568 (showed red line). The moving averages which is a lagging indicator has given a bullish crossover after a bearish crossover in the month of March 2017, indicating that prices will move in the north. One of the popular indicator RSI has also moved in a positive direction after giving a positive divergence, currently it is above the center line. As per advance technicals which is Wave theory, prices have com

MCX Copper: Elliott Wave analysis and forecasting

Image
MCX  Copper (Continuous Daily chart) MCX Copper last year made a high of 415 and formed a base close to 365 levels, thus giving an indication that the firm downtrend is over and prices are now set to start a positive trend. The downtrend was ended in the month of November 2016 after breaking the downward sloping blue channel. As per Wave theory, after steep rise from 300 to 415 levels, prices are in the making of Flat pattern (3-3-5). As of now it seems that wave c of the flat pattern is over and prices are set to resume the uptrend. However, break of 365 will open other possibilities, which can eventually turn into another pattern. In short, as far as 365 is protected on the downside the bias is positive for MCX Copper as it can surpass 415 levels in near term.

MCX Crude Oil on the brink to reverse

Image
MCX Crude Oil Daily continuous chart The benchmark WTI crude oil, in the last month of last year rallied and crossed the level of $55 per barrel after OPEC and Non- OPEC members agreed to cut down the production. However, in the following month the inventories suddenly spiked up despite the measures taken, thus making Crude oil vulnerable. After the events occurred, prices were moving in a range of $53-$55 per barrel and it continues to remain so, but how long? MCX Crude showed massive gains last week when it crossed 3700 levels but it was short lived as it reversed on the same day, thus showing loss of momentum by buyers. The overall picture indicates that the resistance is now fixed at 3700 levels. Technically speaking, prices has not discontinued the higher high and higher low formation. It is also above both the moving averages (20&50), giving an indication that the trend is positive. However, MACD has given a sell signal and RSI have started falling. As pe

MCX Nat Gas: Impulse or Zigzag?

Image
MCX NatGas Daily Continuous Chart MCX Natural Gas is outperforming from the start of this year. Price continues to move in a positive direction forming a higher high and higher low. Moving averages are also moving higher indicating that the trend is firmly positive. From late March 2016 prices started moving in an impulse fashion and completed either wave 1 or wave a at 225 levels. Thereafter the counter trend was a 3 wave structure and was also within 61.8% of wave a. Here the possibility of Zizgag is open. The possibility of impulse wave 3 is also likely only if wave 4 does not overlap in the territory of wave 1 which is 225.  As per Zigzag wave c, which is ongoing is almost on the verge of termination as it has gone till 100% projection of wave a to wave b. Any move below 225 will confirm that it is a zigzag pattern. However, if prices continue to remain above 250, then the possibility of 350 is likely. In short, expect prices to reverse and move down till 2

MCX Nickel: Hovering near resistance

Image
MCX Nickel Daily Continuous chart From the above daily continuous chart of MCX Nickel, it is visible that prices are consolidating near the resistance of the upward sloping blue channel. However, prices are trading above both the short term moving averages 20 EMA (red) and 50 SMA (blue) but the momentum seems to be slowing down. RSI on daily chart has exhibited negative divergence and MACD has already given a negative signal by crossing the signal line from above. Looking from wave angle, prices after completing wave a at 816 in the month of November 2016 fell sharply for three consecutive sessions followed by a rise which is still intact. As of now it is possible that the first wave will be a flat structure as the ongoing wave has retraced more that 61.8% of wave a which was a three day fall. The possibility for the ongoing wave to cross 800 is likely and can also test 816. After testing or crossing 816 to a certain extent, expect a steep fall which can drag prices