MCX Nickel: Hovering near resistance
MCX Nickel Daily Continuous chart
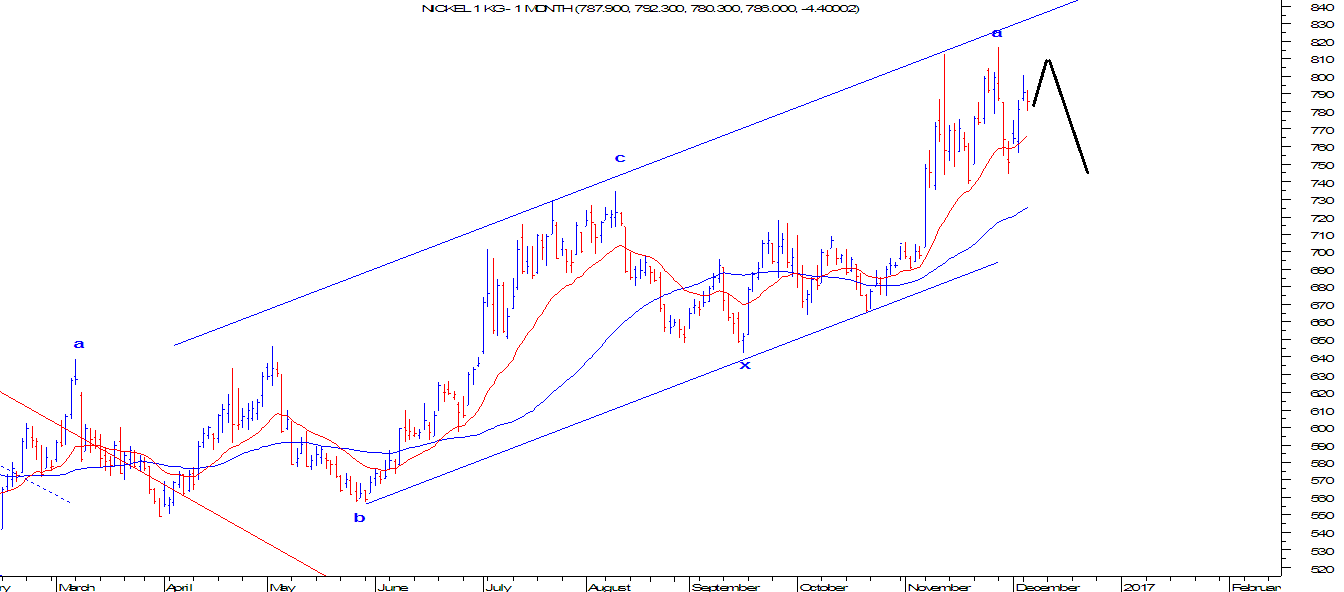
From the above daily continuous chart of MCX Nickel, it is visible that prices are consolidating near the resistance of the upward sloping blue channel. However, prices are trading above both the short term moving averages 20 EMA (red) and 50 SMA (blue) but the momentum seems to be slowing down. RSI on daily chart has exhibited negative divergence and MACD has already given a negative signal by crossing the signal line from above.
Looking from wave angle, prices after completing wave a at 816 in the month of November 2016 fell sharply for three consecutive sessions followed by a rise which is still intact. As of now it is possible that the first wave will be a flat structure as the ongoing wave has retraced more that 61.8% of wave a which was a three day fall. The possibility for the ongoing wave to cross 800 is likely and can also test 816. After testing or crossing 816 to a certain extent, expect a steep fall which can drag prices lower till the end of wave a.
In short, Nickel can rise above 800 and can possibly test 816 but the momentum will continue to be slow on the upside. The follow through will drag prices lower till 745 levels on the downside.


Comments
Axis Bank
G M Breweries Ltd
Bharat Petroleum Corp. Ltd
Shoppers Stop Ltd
63 Moons Technologies Ltd