MCX Nat Gas: Impulse or Zigzag?
MCX NatGas Daily Continuous Chart
MCX Natural Gas is
outperforming from the start of this year. Price continues to move in a
positive direction forming a higher high and higher low. Moving averages are
also moving higher indicating that the trend is firmly positive.
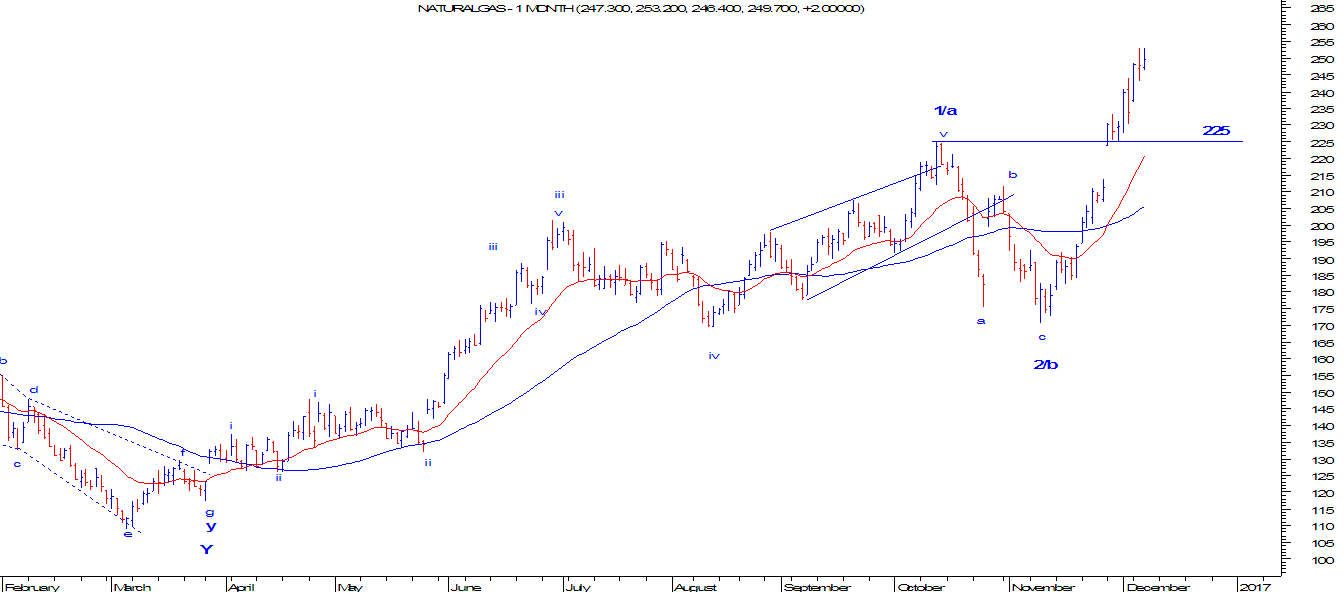
From late March 2016
prices started moving in an impulse fashion and completed either wave 1 or wave
a at 225 levels. Thereafter the counter trend was a 3 wave structure and was
also within 61.8% of wave a. Here the possibility of Zizgag is open. The possibility
of impulse wave 3 is also likely only if wave 4 does not overlap in the
territory of wave 1 which is 225.
As per Zigzag wave c,
which is ongoing is almost on the verge of termination as it has gone till 100%
projection of wave a to wave b. Any move below 225 will confirm that it is a
zigzag pattern. However, if prices continue to remain above 250, then the
possibility of 350 is likely.
In short, expect prices
to reverse and move down till 225 or even lower levels. However, sustainable
move above 250 will open the possibility of 350 levels which is 161.8%
projection of wave a to wave b.


Comments
Hey, thanks for the information. your posts are informative and useful.
Galada Power & Telecommunication Ltd