Posts

MCX Copper: Capturing the downfall
Image
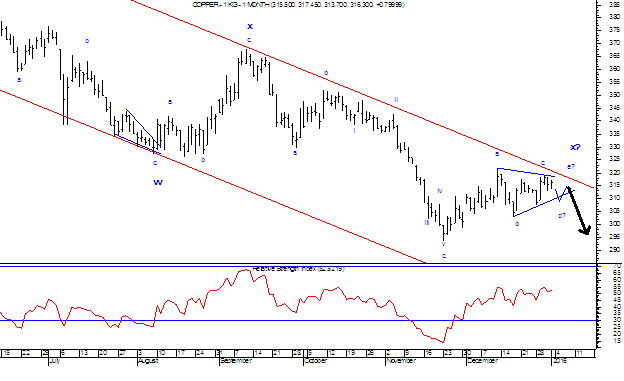
In my previous update " MCX Copper moving in a symmetrical triangle pattern and its post pattern implication". I had mentioned that,    prices will consolidate within range of 315-320 levels and then will reverse to test the level of 295. Prices moved in a thin range 308-315 and completed that triangle pattern on 6th January 2016. Once the pattern was completed, prices opened below the lower trend line of the triangle pattern and made a low of 296.45 on 7th January 2016. As per wave theory, Currently a new leg on downside has started which can drag prices further lower till 290 levels. After completing wave x in a triangle pattern, prices will now move down in the form of wave a. In short, expect Copper to be under pressure and can test the level of 290 going ahead. The resistance will be 308-310 which was earlier acting as a support (polarity reversal). Link:  http://marketanalysiswithmeghmody.blogspot.com/2016/01/mcx-copper-moving-in-symmetrical.html MCX Copper 1

MCX Copper moving in a symmetrical triangle pattern and its post pattern implication

Image
MCX Copper is under performing after China started slowing down in the mid of 2015. Since then it is moving precisely in a down ward sloping red channel by forming a lower high and lower low formation. Currently it is consolidating near the resistance of the red channel. It is imperative for prices to reverse, thus continuing the downtrend. However, it seems that before it reverses, it will consume some time and will trade in a thin range of 315-320 levels as it is forming a crucial pattern. As per wave theory, prices are moving in a complex correction pattern (w-x-y-x-z). Currently it is moving in a triangle pattern which is the second counter trend i.e. wave x. In wave x still wave d and e are left to form. After completing triangle pattern, prices will move down in the form of wave z. In short, prices will consolidate within range of 315-320 levels and then will reverse to test the level of 295. MCX Copper February'16 Contract Daily chart

USDINR: Impulsive Wave

Image
From the below Daily chart it is clearly visible that the current trend for this pair is negative. Even by using simple channeling techniques one can understand the trend of the asset class. In this chart prices are moving in a falling red channel which is downward sloping. Prices are expected to move lower after breaching the ending diagonal pattern. The current fall is steep thus giving an indication that the trend is here to stay. As per wave theory, in October 2015 when prices were quoting near to 64.80 levels, the pair moved higher in a three wave structure (a-b-c) and completed on higher degree. After completing wave c 67.15 in an ending diagonal pattern, prices are moving down in a impulsive pattern which has five wave structure in it. Currently it completed wave ii which is a counter trend at 66.40 levels. Now it will resume the downtrend by starting with wave iii, which can move down till 65.50 levels. In short, prices are negatively poised and can move down goin

EURUSD : Ending Diagonal, Running Triangle and Elliott Wave counts

Image
The common currency surged post ECB meet in the early December meet as the ECB president disappointed market by going for only 10 bps cut for deposit rate to -0.30% where market was expecting -0.40%. Now the common currency is waiting for the FED outcome which is set to release on 16th December 2015. Before the ECB meet, the pair already started to form an ending diagonal pattern and post meet it surged from the lows of 1.0506 till 1.0981 levels. Later it moved in a sideways formation which looks like running barrier triangle pattern (a-b-c-d-e). It seems that it has either completed wave e of triangle or one minor leg is pending. The confirmation will only be obtained if prices move above 1.1045 levels, taking out cluster of resistances.  A move above 1.1045 will open positive possibilities and prices can test the level of 1.1070 followed by 1.1240 levels which is 61.8% retracement of wave a. In short, the bias remains positive for EURUSD as it can test the level of 1.12

GBPINR: Neo wave, Extracting Triangle, Diametric pattern and post pattern implication

Image
GBPINR is moving in a extracting triangle pattern which is a part of Neo wave pattern. The pair is moving in a complex correction pattern.  In an extracting triangle pattern, the major trend contracts going ahead. Having said that, in the below chart wave a of the triangle pattern starts on 13th April 2015 with the bottom of 90.85 and completed wave a at 101.03. It then formed wave b in an irregular flat pattern followed by wave c, which was smaller than wave a in length. Wave a surged by 10.18 points (101.03-90.85) whereas wave c took 8.48 points (105.62-97.14). Wave d came down in a three wave structure followed by wave e which is the last leg of the triangle pattern in which wave a was a diametric pattern followed by wave b and now it is moving up in the last leg of wave e i.e. wave c. Wave e must be smaller than wave c in length. Wave e should surge less than 8.48 points, as of now it have soared roughly 3 points. The resistance for wave e should be somewhere near 102.50 leve

WTI Crude to test $53 levels (Elliott Wave Analysis)

Image
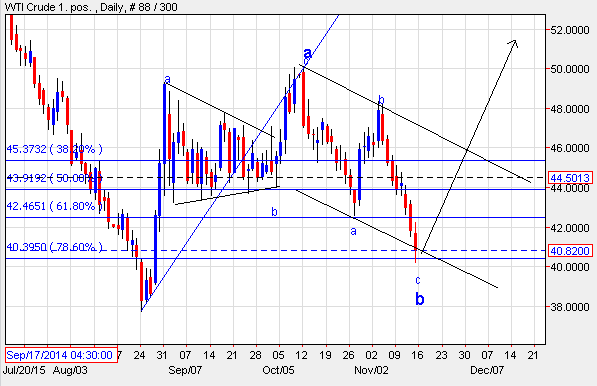
In my previous update " WTI Crude to surge going ahead", I had mentioned that " E xpect prices to move down for short term at $44 per barrel  followed by resumption of an uptrend which can push prices higher near till $53 per barrel". WTI made a high of $48 before sinking to $40 on 13th November 2015. It tumbled to more than 8% on weekly basis. However, the bias continues to be positive as prices are moving in a sideways direction after surging from the bottom of $37 per barrel. As per wave theory, from the bottom of $37.75 till $49.32 the wave structure was an  impulse. At $49.32 wave a was completed followed by wave b which completed five waves in a triangle pattern and then wave c again in an impulse pattern. The following wave is wave x or wave b (if I mark the prior three waves as wave a on a higher degree)  as it is coming down in a three wave structure. It has also retraced near to 80% of the previous rise indicating flat structure. In short, th

Gold: Anticipated happened and Elliott wave forecasting

Image
In my previous update " Gold in a complex correction pattern", I had mentioned that,    A decisive move below $1155 will open the possibility of $1076 on the downside with the resistance of $1230. Gold after breaching the level of  $1155 plunged and made a low of $1074 on 12th November 2015. The downfall was steep after hawkish comments by FED chair person Janet Yellen who gave a hint for a possible rate hike in mid December 2015, thus making Dollar strong and Gold weak. Gold is moving precisely in a falling channel, after facing the resistance of $1191, prices reversed and moved below its previous low of $1076, marking a low of $1074. The downfall was impulsive in nature as expected. As it is moving in wave Y where it is currently forming double correction (a-b-c-x-a-b-c). This double correction can be then converted into triple correction (a-b-c-x-a-b-c-x-a-b-c) or can terminate at $1074 levels. As of now one leg on upside is expected for gold now. In